Analyzer
The analyzer is one of the key modules of jxscout and generates the matches that appear in the VSCode extension.
jxscout has a set of built-in analyzers enabled by default, but you can also build your own analyzers and define your own match generation rules.
In this tutorial, we will go through how you can configure and extend jxscout analysis capabilities.
Concept
The analyzer runs on top of beautified JS, HTML, and Reversed Source files. Based on the project configuration, it runs multiple analyzers—built-in or custom ones you define. These analyzers analyze source code and generate matches. A match is a data structure with the following fields:
// Data structure of a match
{
  // `kind` of a match is basically the type of information that this match corresponds to
  "kind": "path",
  // `value` is the information extracted from the source code by the analyzer
  "value": "/api/users",
  // `start` and `end` are the 0-based positions in the source code where this match was extracted.
  // This is used by the VSCode extension to know where to jump when clicking on a match
  "start": { "line": 1, "column": 1 },
  "end": { "line": 1, "column": 10 }
}
Setting up the lab
To explore how to extend and write your own analyzers, create a new project analyzer-tutorial with scope *labs.jxscout.app*.
Open https://labs.jxscout.app/labs/noisy-navigation/ in your browser to get started.
Built-in analyzers
First, let's look at the built-in analyzers and how to configure them.
Run the following command to check which analyzers are enabled by default. The list of built-in analyzers is under analyzer > built_in_analyzers.
$ jxscout-pro-v2 -c print-full-project-settings --project-name analyzer-tutorial
For example, here is the default configuration for the path analyzer:
// path is the name of the analyzer.
"path": {
    // `enabled` means that jxscout will run this analyzer to extract paths in this case
    "enabled": true,
    // `file_types` is the list of file types where this analyzer will run (js, html, or reversed_source)
    // One note: reversed_source files are JS files, but jxscout distinguishes js files from reversed_sources
    // for tracking purposes
    "file_types": [
        "js",
        "html",
        "reversed_source"
    ]
}
The built-in analyzers use different techniques, such as AST parsing and regexes, to create matches. However, this complexity is abstracted away from you.
The names of the built-in analyzers are the same as the match kinds they generate. This is not required for custom analyzers, because you might have an analyzer that generates more than one match kind (for example a custom analyzer script that finds both path and query_param).
You can also have custom analyzers that generate matches of the same kind as built-in ones, allowing you to extend the coverage of built-in analyzers.
Changing the VSCode matches view structure
Before jumping into customizing built-in analyzers and creating custom analyzers, one important concept to know is the fact that the VSCode Matches view structure is fully customizable.
This section shows how to configure the VSCode matches view, so that later you can add your own match kinds to the tree.
An overview of settings
We won’t go deep into settings here—separate documentation will cover that—but a basic understanding is enough for this tutorial.
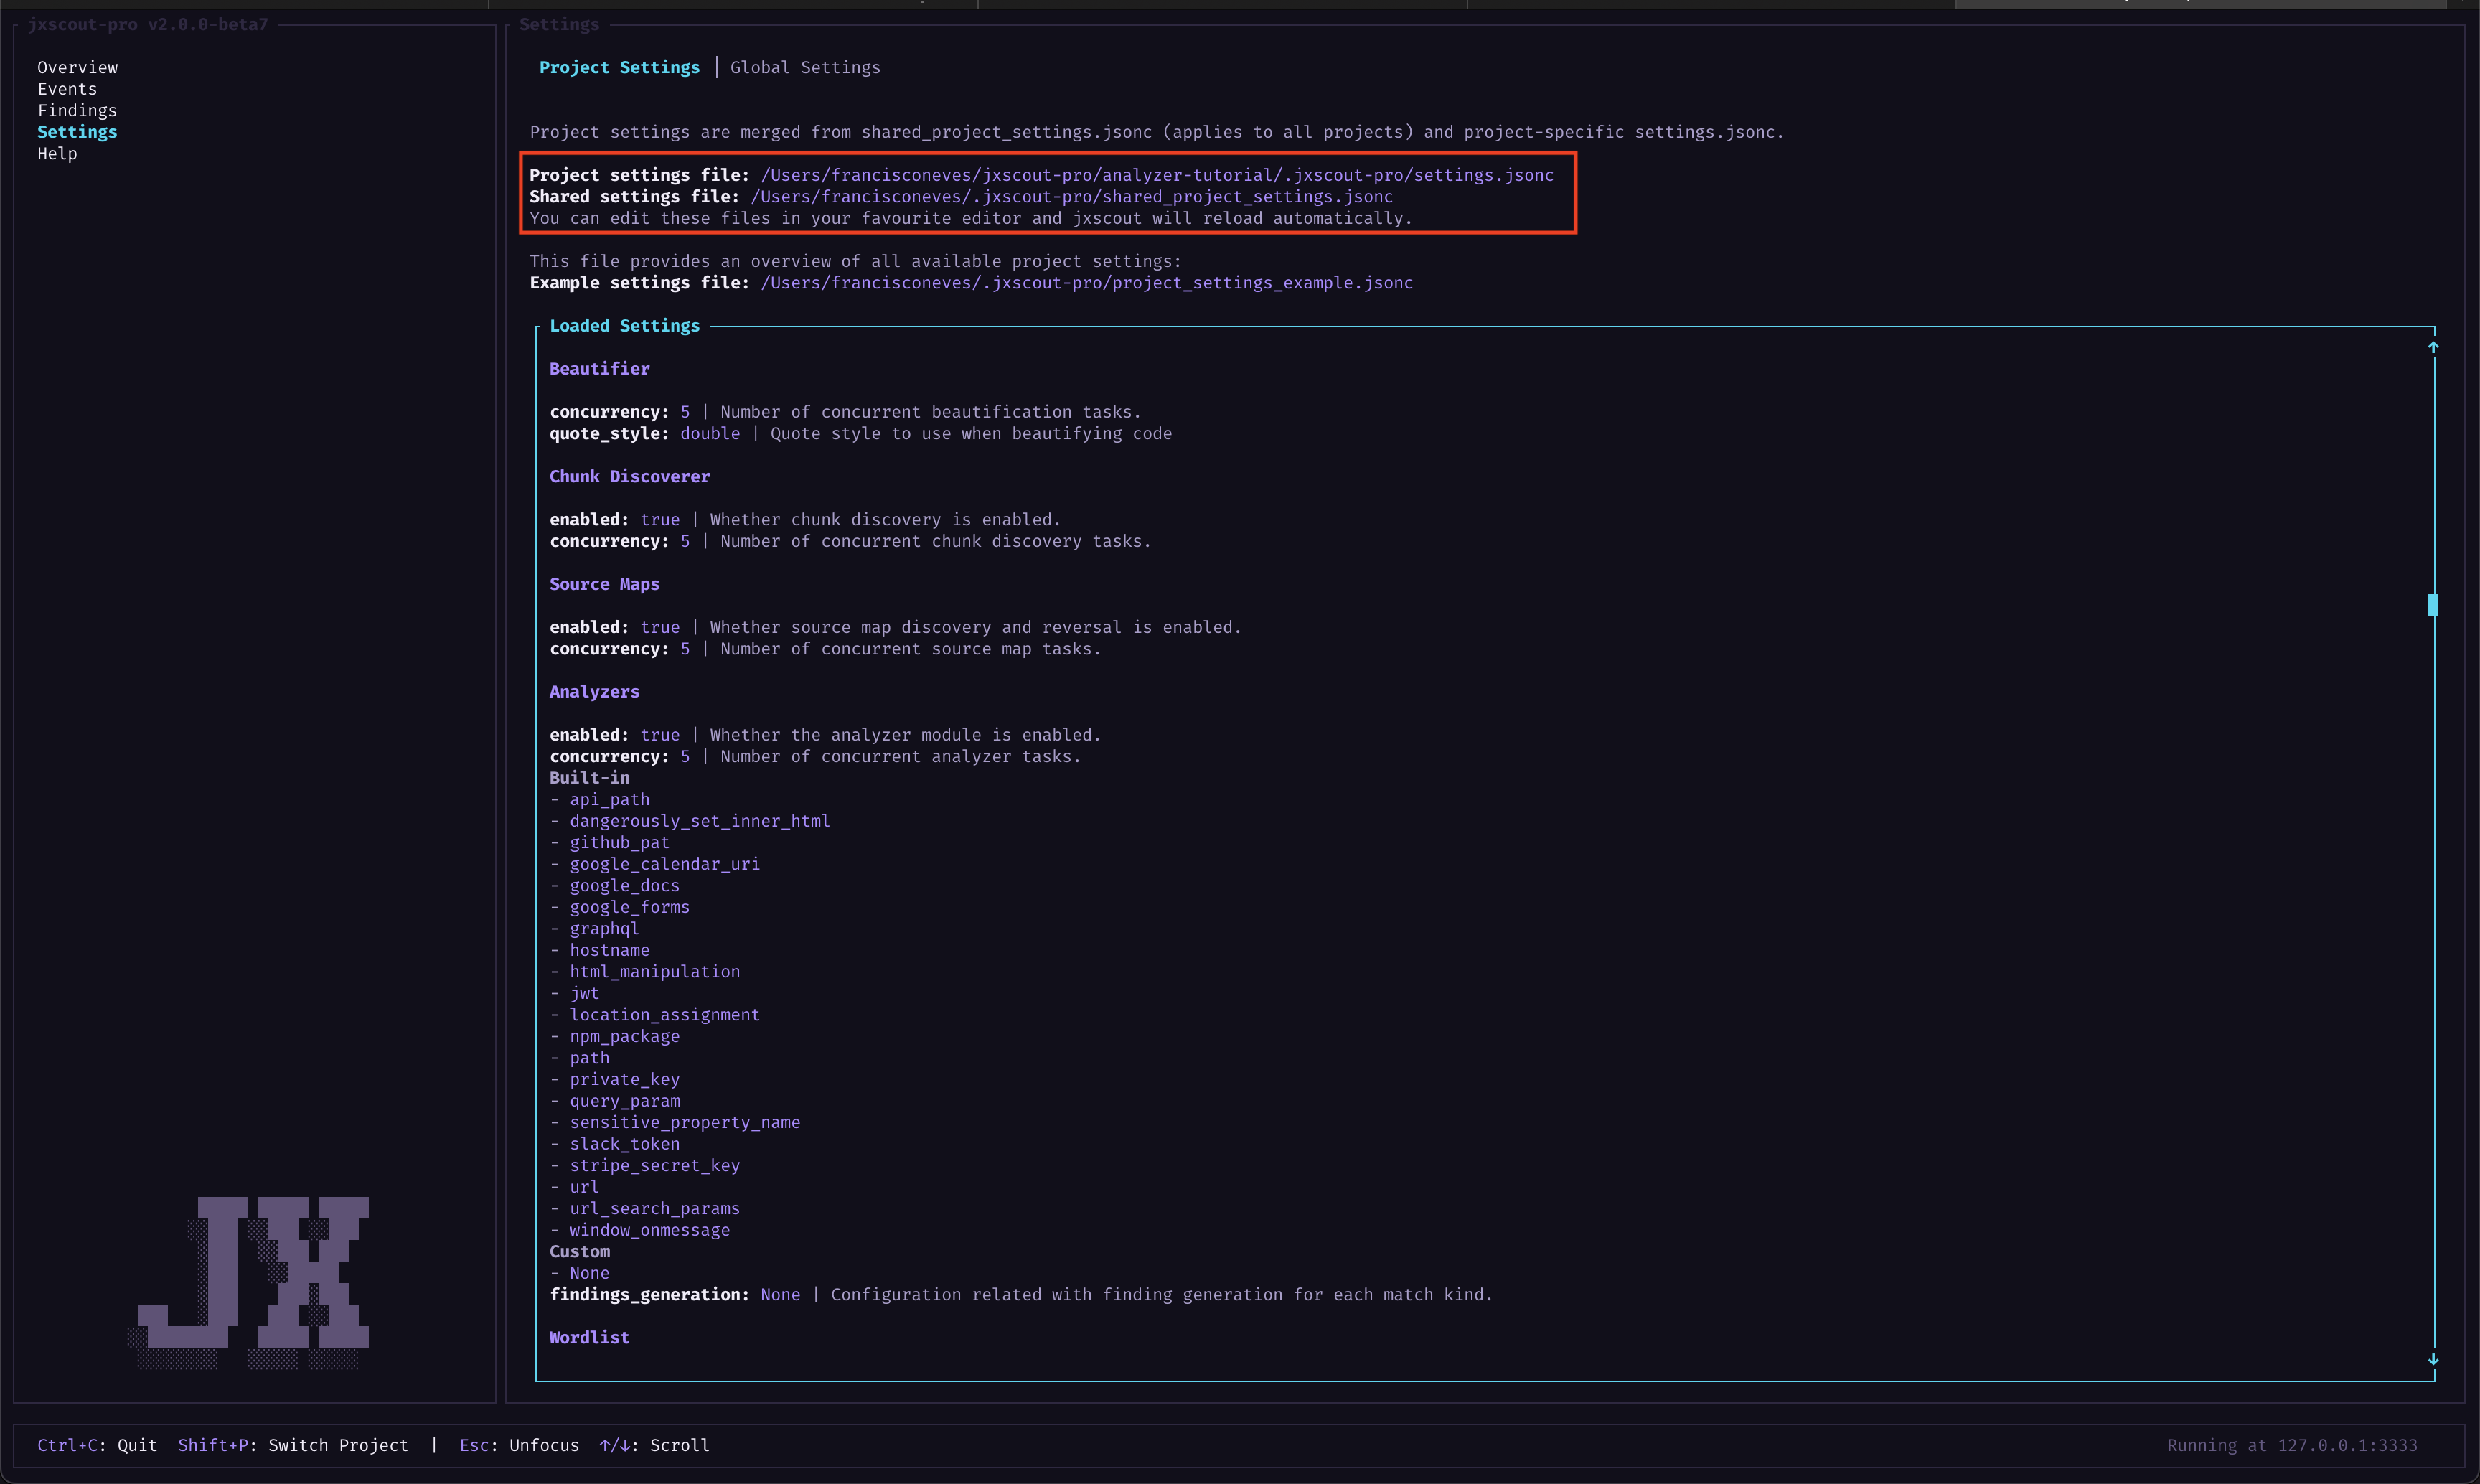
The settings screen (below) shows the current settings for your project. This screen is read-only. To edit settings, update either the project settings file or the shared project settings file. The final settings are the result of merging jxscout defaults, your shared project settings, and the current project settings.
Press Enter in this view and use the arrow keys to scroll through the settings in case you want to explore what's available.
When you edit one of the settings files, jxscout will detect changes and auto-reload to use the latest settings you configured.
Updating the settings
As an example of how you can configure the Matches view, we will do three exercises:
- Remove the "HTML Manipulation" node from the Matches view
- Group the "Paths" and "API Paths" into a single node
- Change the icon of the "Hostname" to a custom one
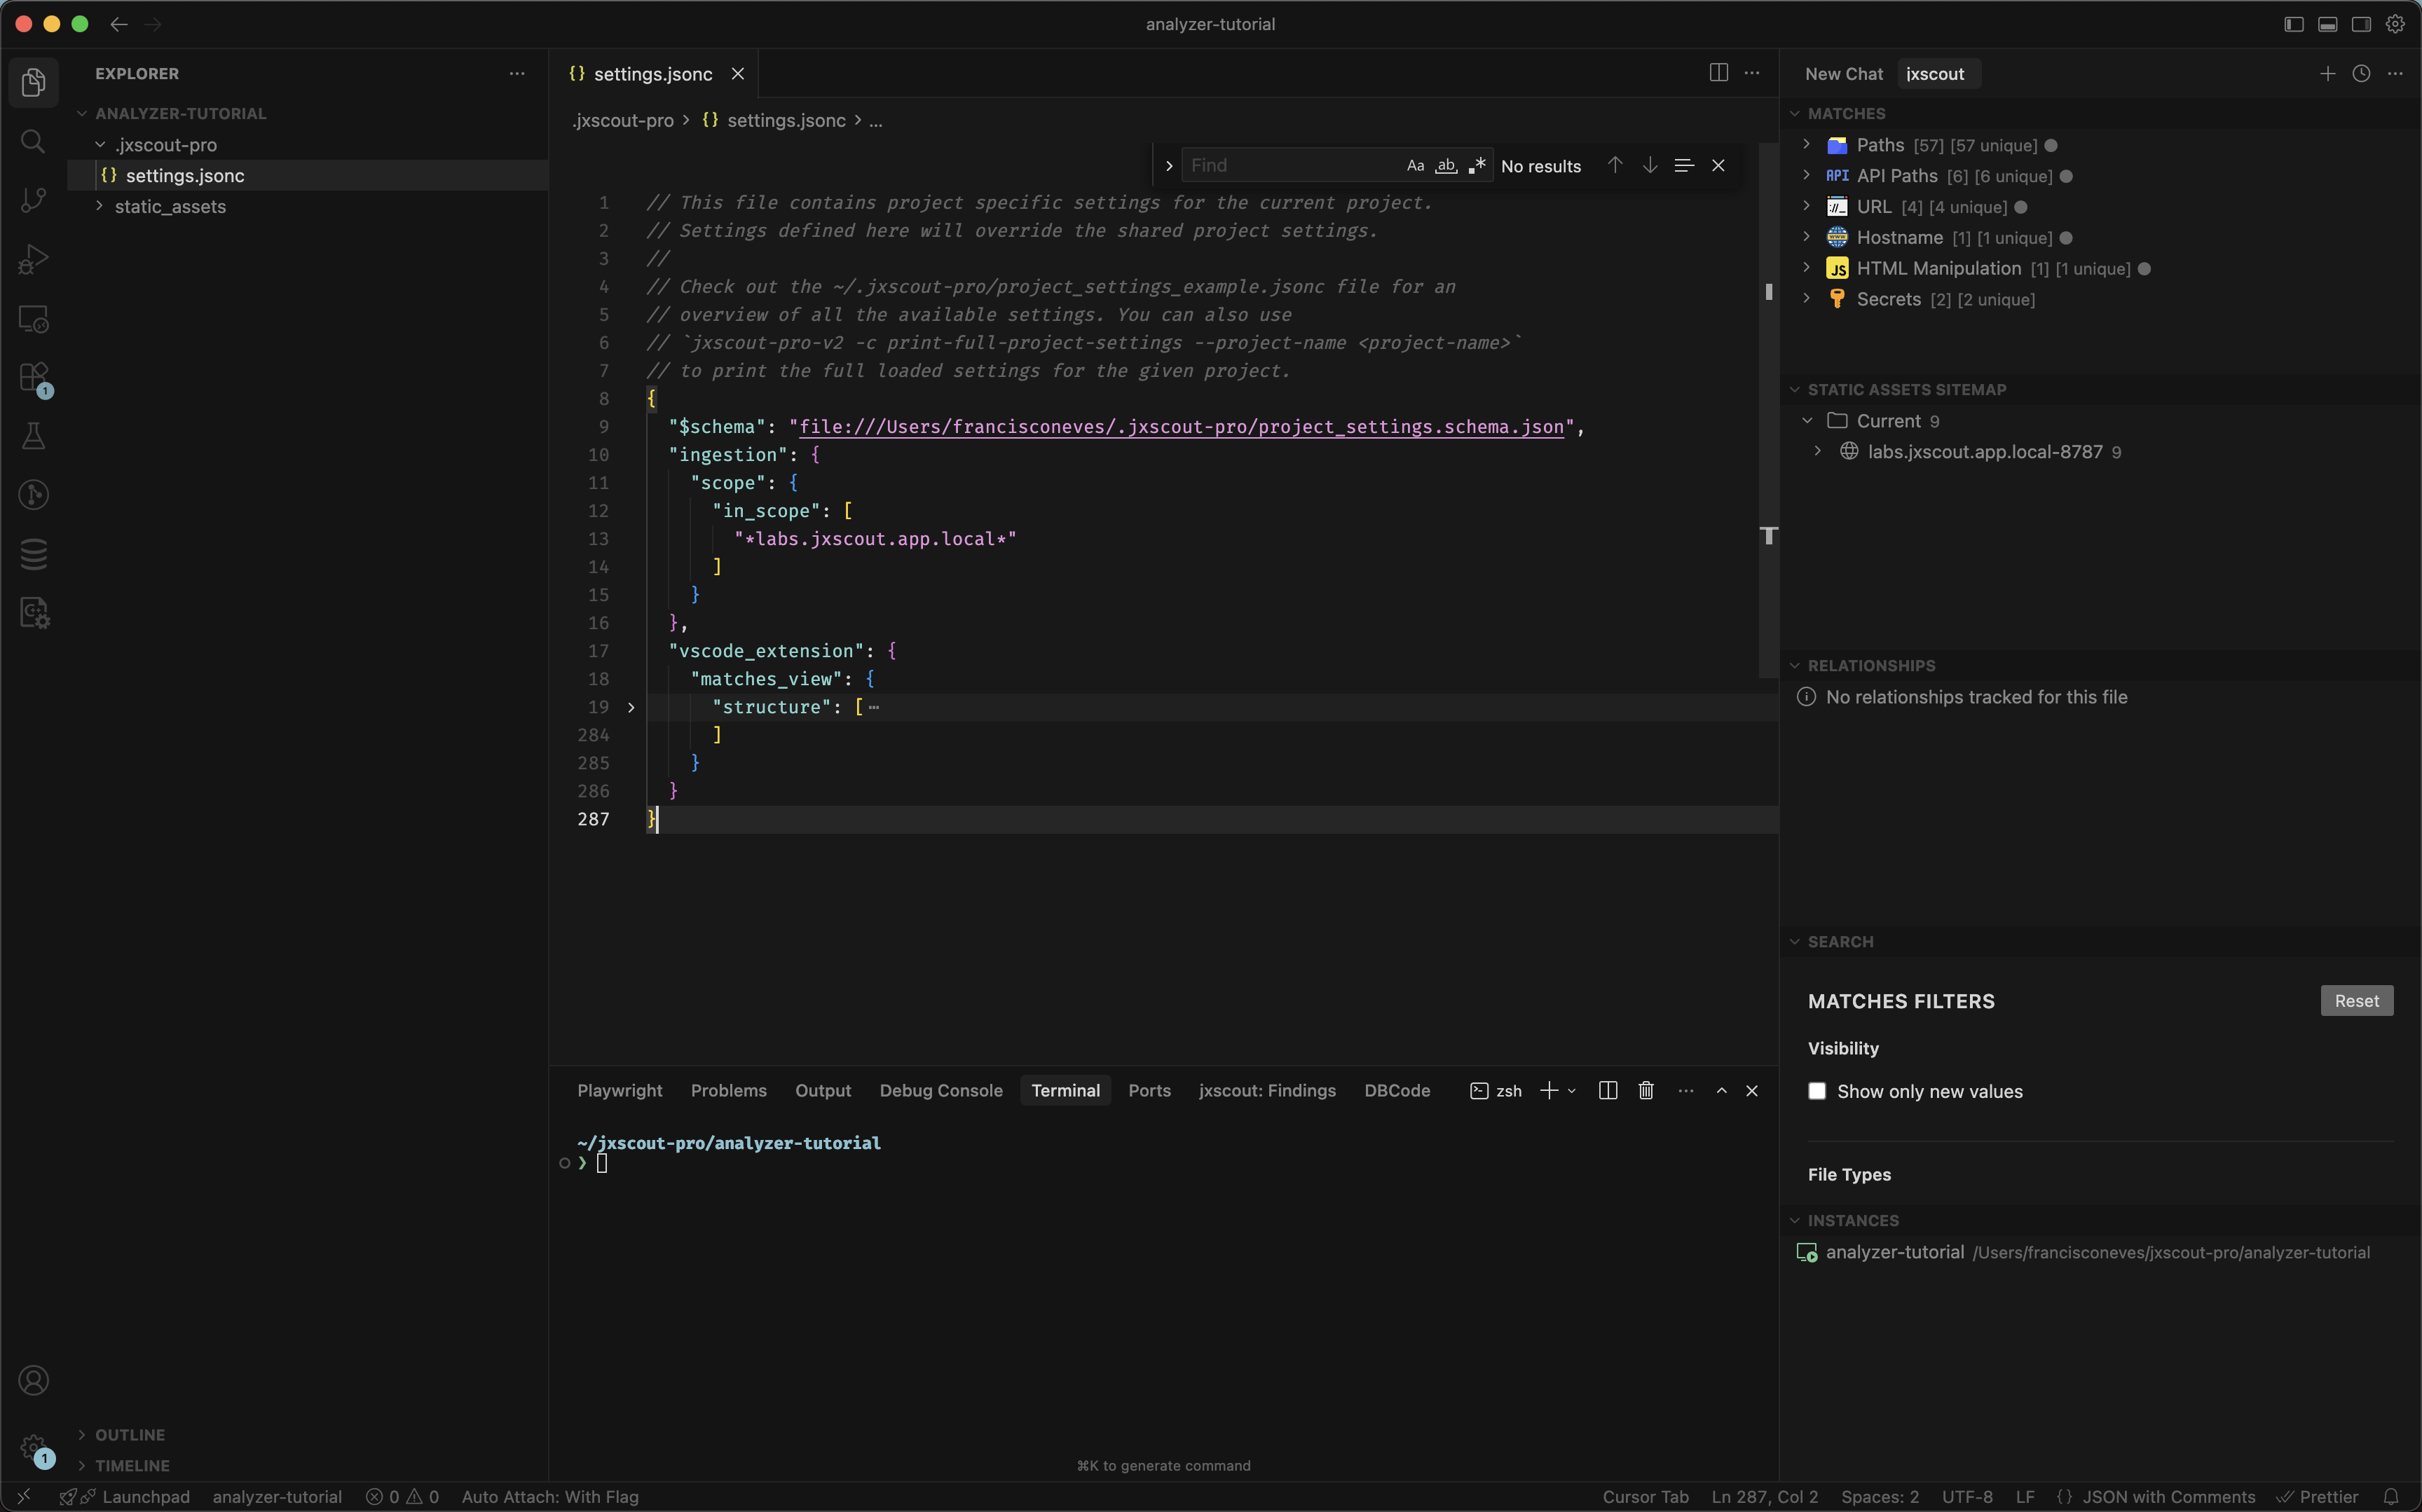
The matches view structure can be customized by changing the JSON on vscode_extension > matches_view > structure.
Since extend_default_structure defaults to true, you only need to add your custom entries — they are automatically merged with the built-in defaults. You can run print-full-project-settings to see the full default structure:
$ jxscout-pro-v2 -c print-full-project-settings --project-name analyzer-tutorial
If you want to fully replace the default structure (e.g., remove built-in match kinds), set extend_default_structure: false under vscode_extension > matches_view and provide the complete structure yourself.
Let's take a look at a structure entry.
// ...
{
  // `type` can be either
  // - `navigation` for navigation-only nodes in the tree, or
  // - `match` for showing a specific kind of matches
  "type": "navigation",
  // `label` is a property of `navigation` nodes — the text displayed in VSCode
  "label": "HTML Manipulation",
  // `icon` is the icon to be displayed.
  // - use "jxscout:<name>" prefix to use the jxscout icons
  // - use "vscode:<name>" prefix to use native VSCode icons (https://code.visualstudio.com/api/references/icons-in-labels#icon-listing)
  // - use "file:/path/to/icon.svg" to use custom icons
  "icon": "jxscout:javascript",
  // `children` defines the child nodes of this navigation node (both `navigation` and `match` types)
  "children": [
    {
      "type": "match",
      // `match_kind` is used to display matches of this kind at this level
      "match_kind": "html_manipulation",
      "icon": "jxscout:javascript",
      // `dont_collapse_individual_matches`
      // - when false or empty: same-value matches are collapsed into one node (e.g. two /api matches → one node)
      // - when true: every match is shown as its own node (e.g. two window.onmessage = e matches → two nodes)
      "dont_collapse_individual_matches": false
    }
  ]
}
// ...
Now let's edit the matches view to complete the exercises.
Removing the HTML Manipulation node
Since removing a built-in item can't be done by merging, you need to set extend_default_structure: false and provide the complete structure without the "HTML Manipulation" entry. Copy the full vscode_extension block from print-full-project-settings into your project settings, set extend_default_structure: false, then remove the "HTML Manipulation" entry from the structure array and save your project file. After you do that, you should see that the VSCode extension auto reloads, and the "HTML Manipulation" node is no longer there. And we are done with this example!
Grouping navigation nodes
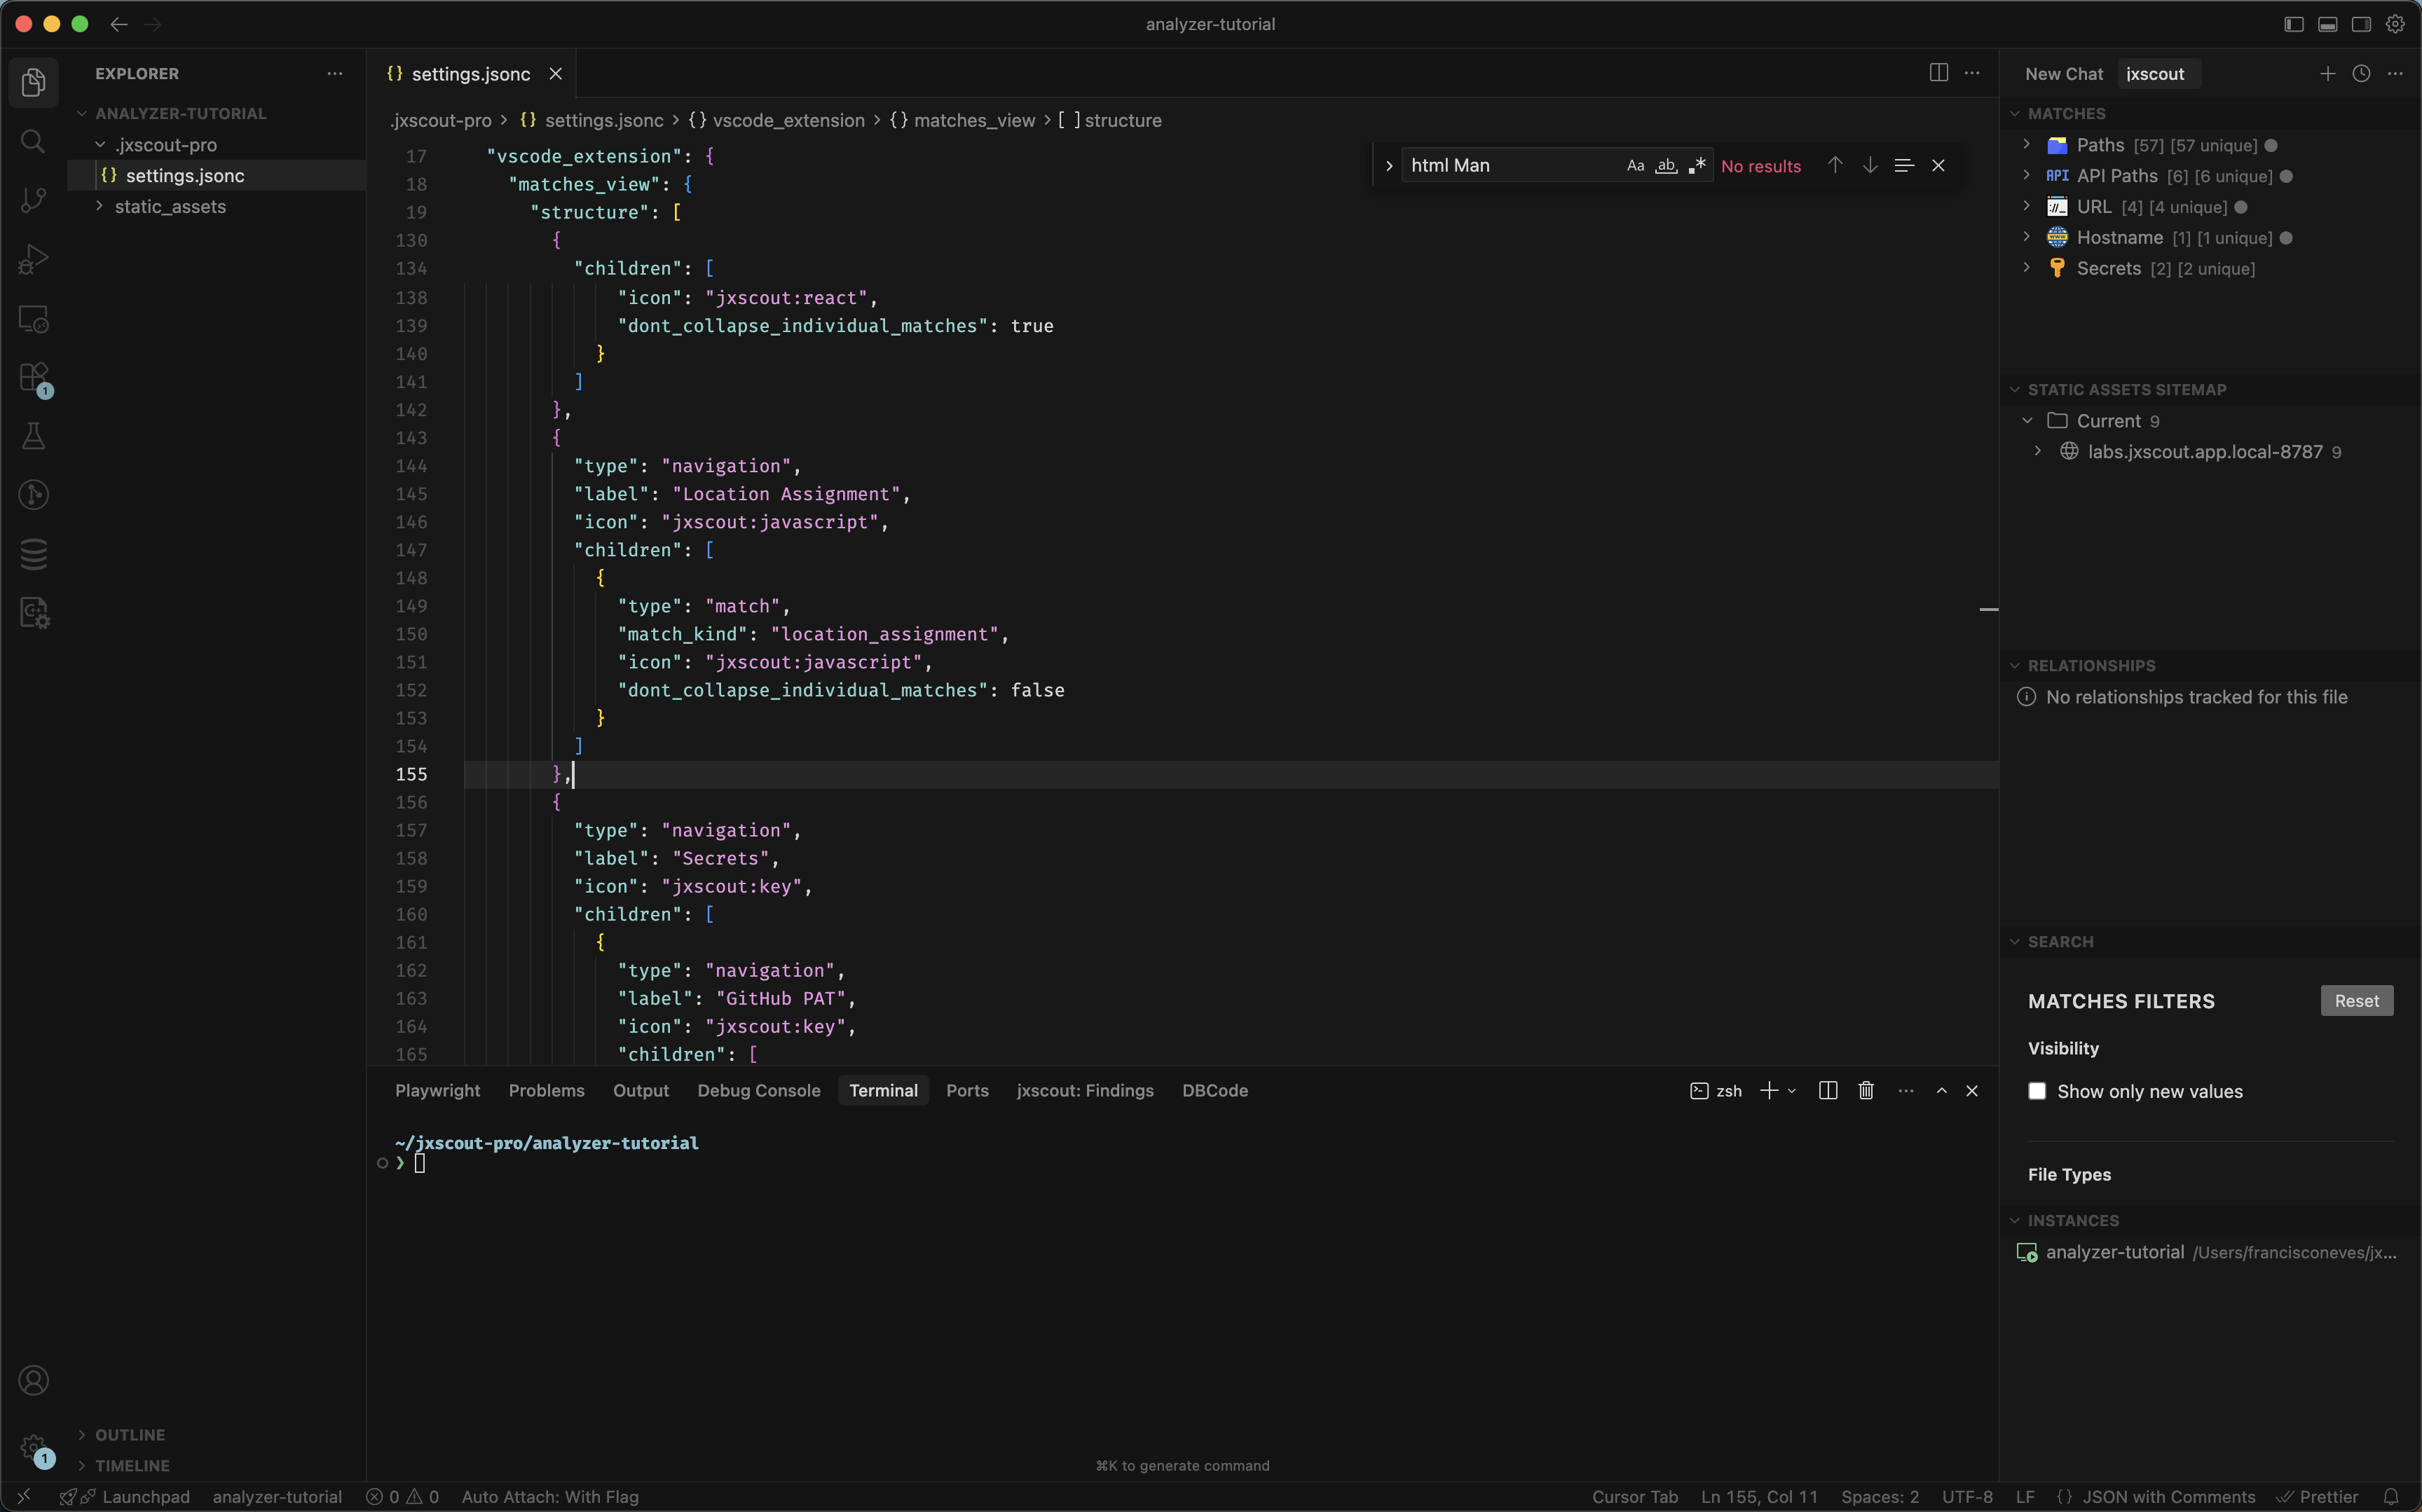
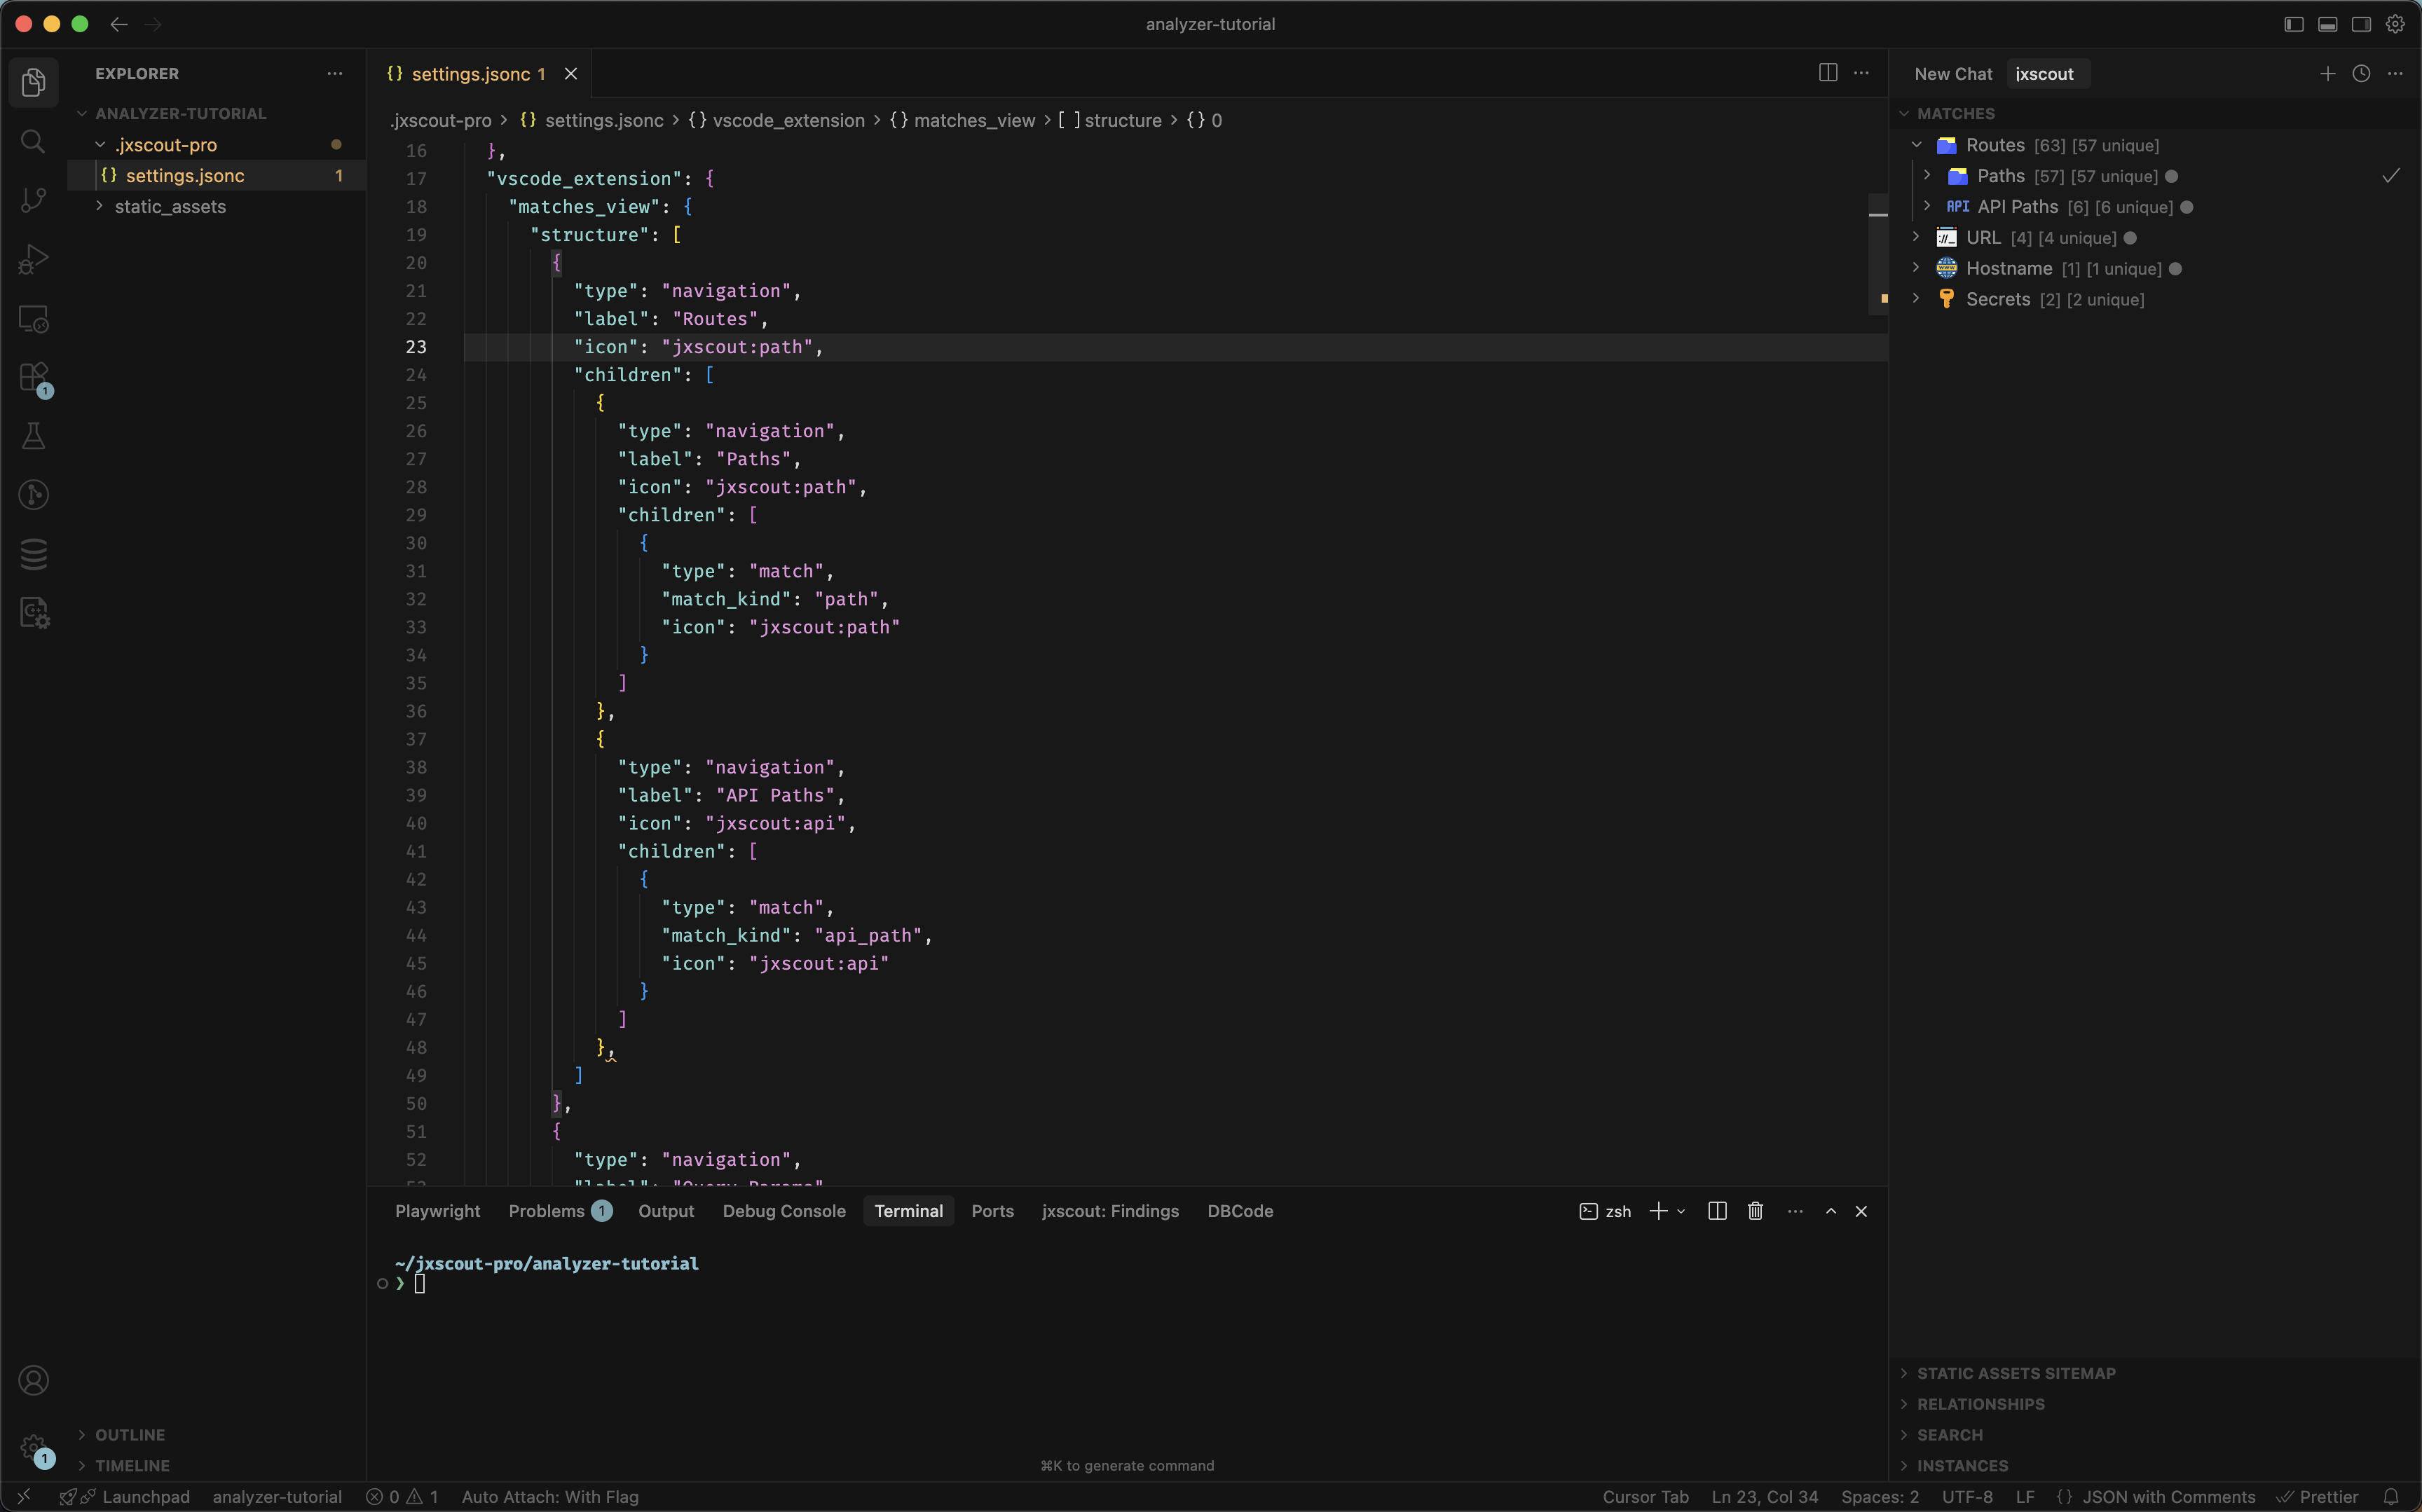
Let's try to group together "Paths" and "API Paths" under the same parent node "Routes". To do that, let's find the entries for "Paths" and "API Paths" in the matches_view structure and update it to look like this:
{
  "type": "navigation",
  "label": "Routes",
  "icon": "jxscout:path",
  "children": [
    {
      "type": "navigation",
      "label": "Paths",
      "icon": "jxscout:path",
      "children": [
        {
          "type": "match",
          "match_kind": "path",
          "icon": "jxscout:path"
        }
      ]
    },
    {
      "type": "navigation",
      "label": "API Paths",
      "icon": "jxscout:api",
      "children": [
        {
          "type": "match",
          "match_kind": "api_path",
          "icon": "jxscout:api"
        }
      ]
    }
  ]
}
After you save, your Matches view should look like this:
Customizing icons
Let's now try to customize the icon for the "Hostname" nodes by using a custom SVG. A good resource for SVGs is SVGRepo. Find one SVG that you like, download it and update the Hostname icon property to use the file:<path_to_svg> format to load your custom SVG.
![]()
Cleaning up
Hopefully with these few examples you have the tools that you need to customize the Matches view to your own taste! If you want to keep the default settings, simply remove the vscode_extension property from your project JSON to rollback.
Analyzer customization basics
We already know how to change the presentation layer of Matches, but we don't know yet how to actually customize how matches are generated. This section is really important because it will allow you to understand how to test out changes and re-analyze your projects as you tune your configuration.
As an exercise, we will do something simple:
- Disable the built-in
html_manipulationanalyzer.
This section assumes that you reset your VSCode Matches view to the default (see Cleaning up).
First let's run the following command and identify where the default configuration for the html_manipulation analyzer exists:
$ jxscout-pro-v2 -c print-full-project-settings --project-name analyzer-tutorial
You should see an entry that looks like this:
{
  // ...
  "analyzer": {
    // ...
    "built_in_analyzers": {
      // ...
      "html_manipulation": {
        "enabled": true,
        "file_types": ["js", "reversed_source"]
      }
      // ...
    }
    // ...
  }
}
Let's copy that single entry and add it to our project settings. The analyzer settings are merged, so we can just add that single entry without copying the whole default configuration if we just want to change this single analyzer.
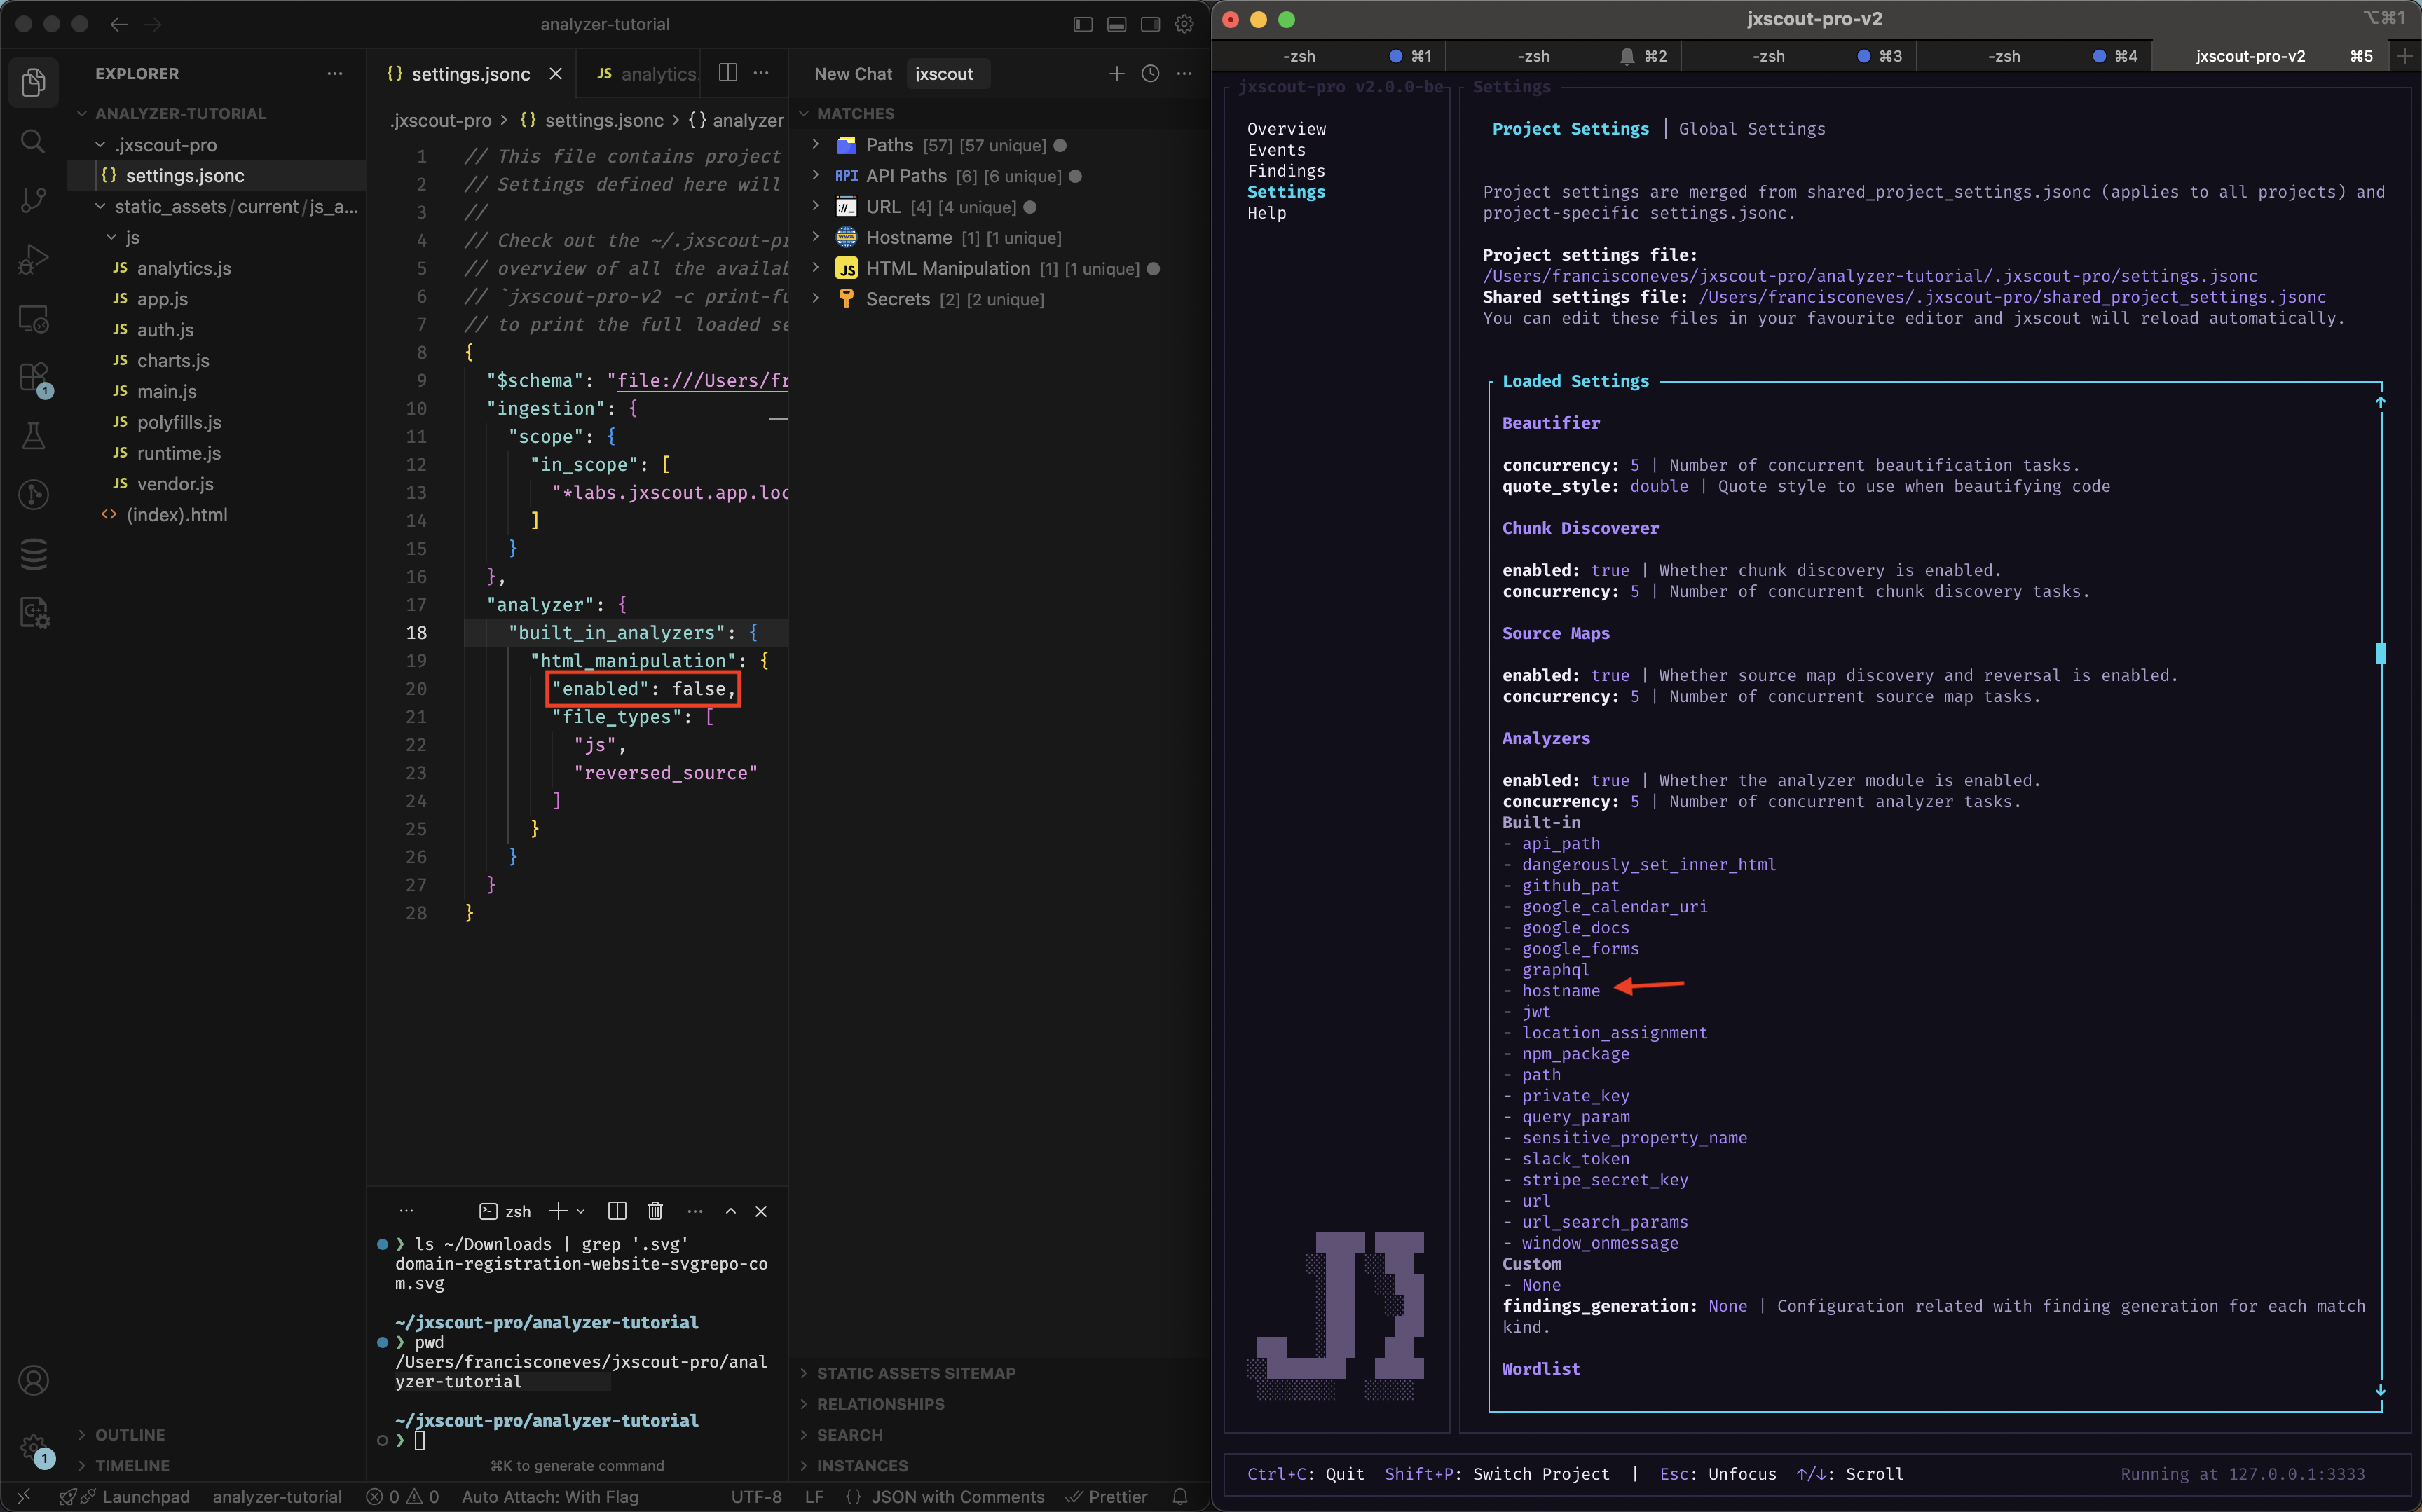
Now change the enabled flag to false. On the settings page of the CLI, you can confirm that this built-in analyzer is no longer enabled.
Before
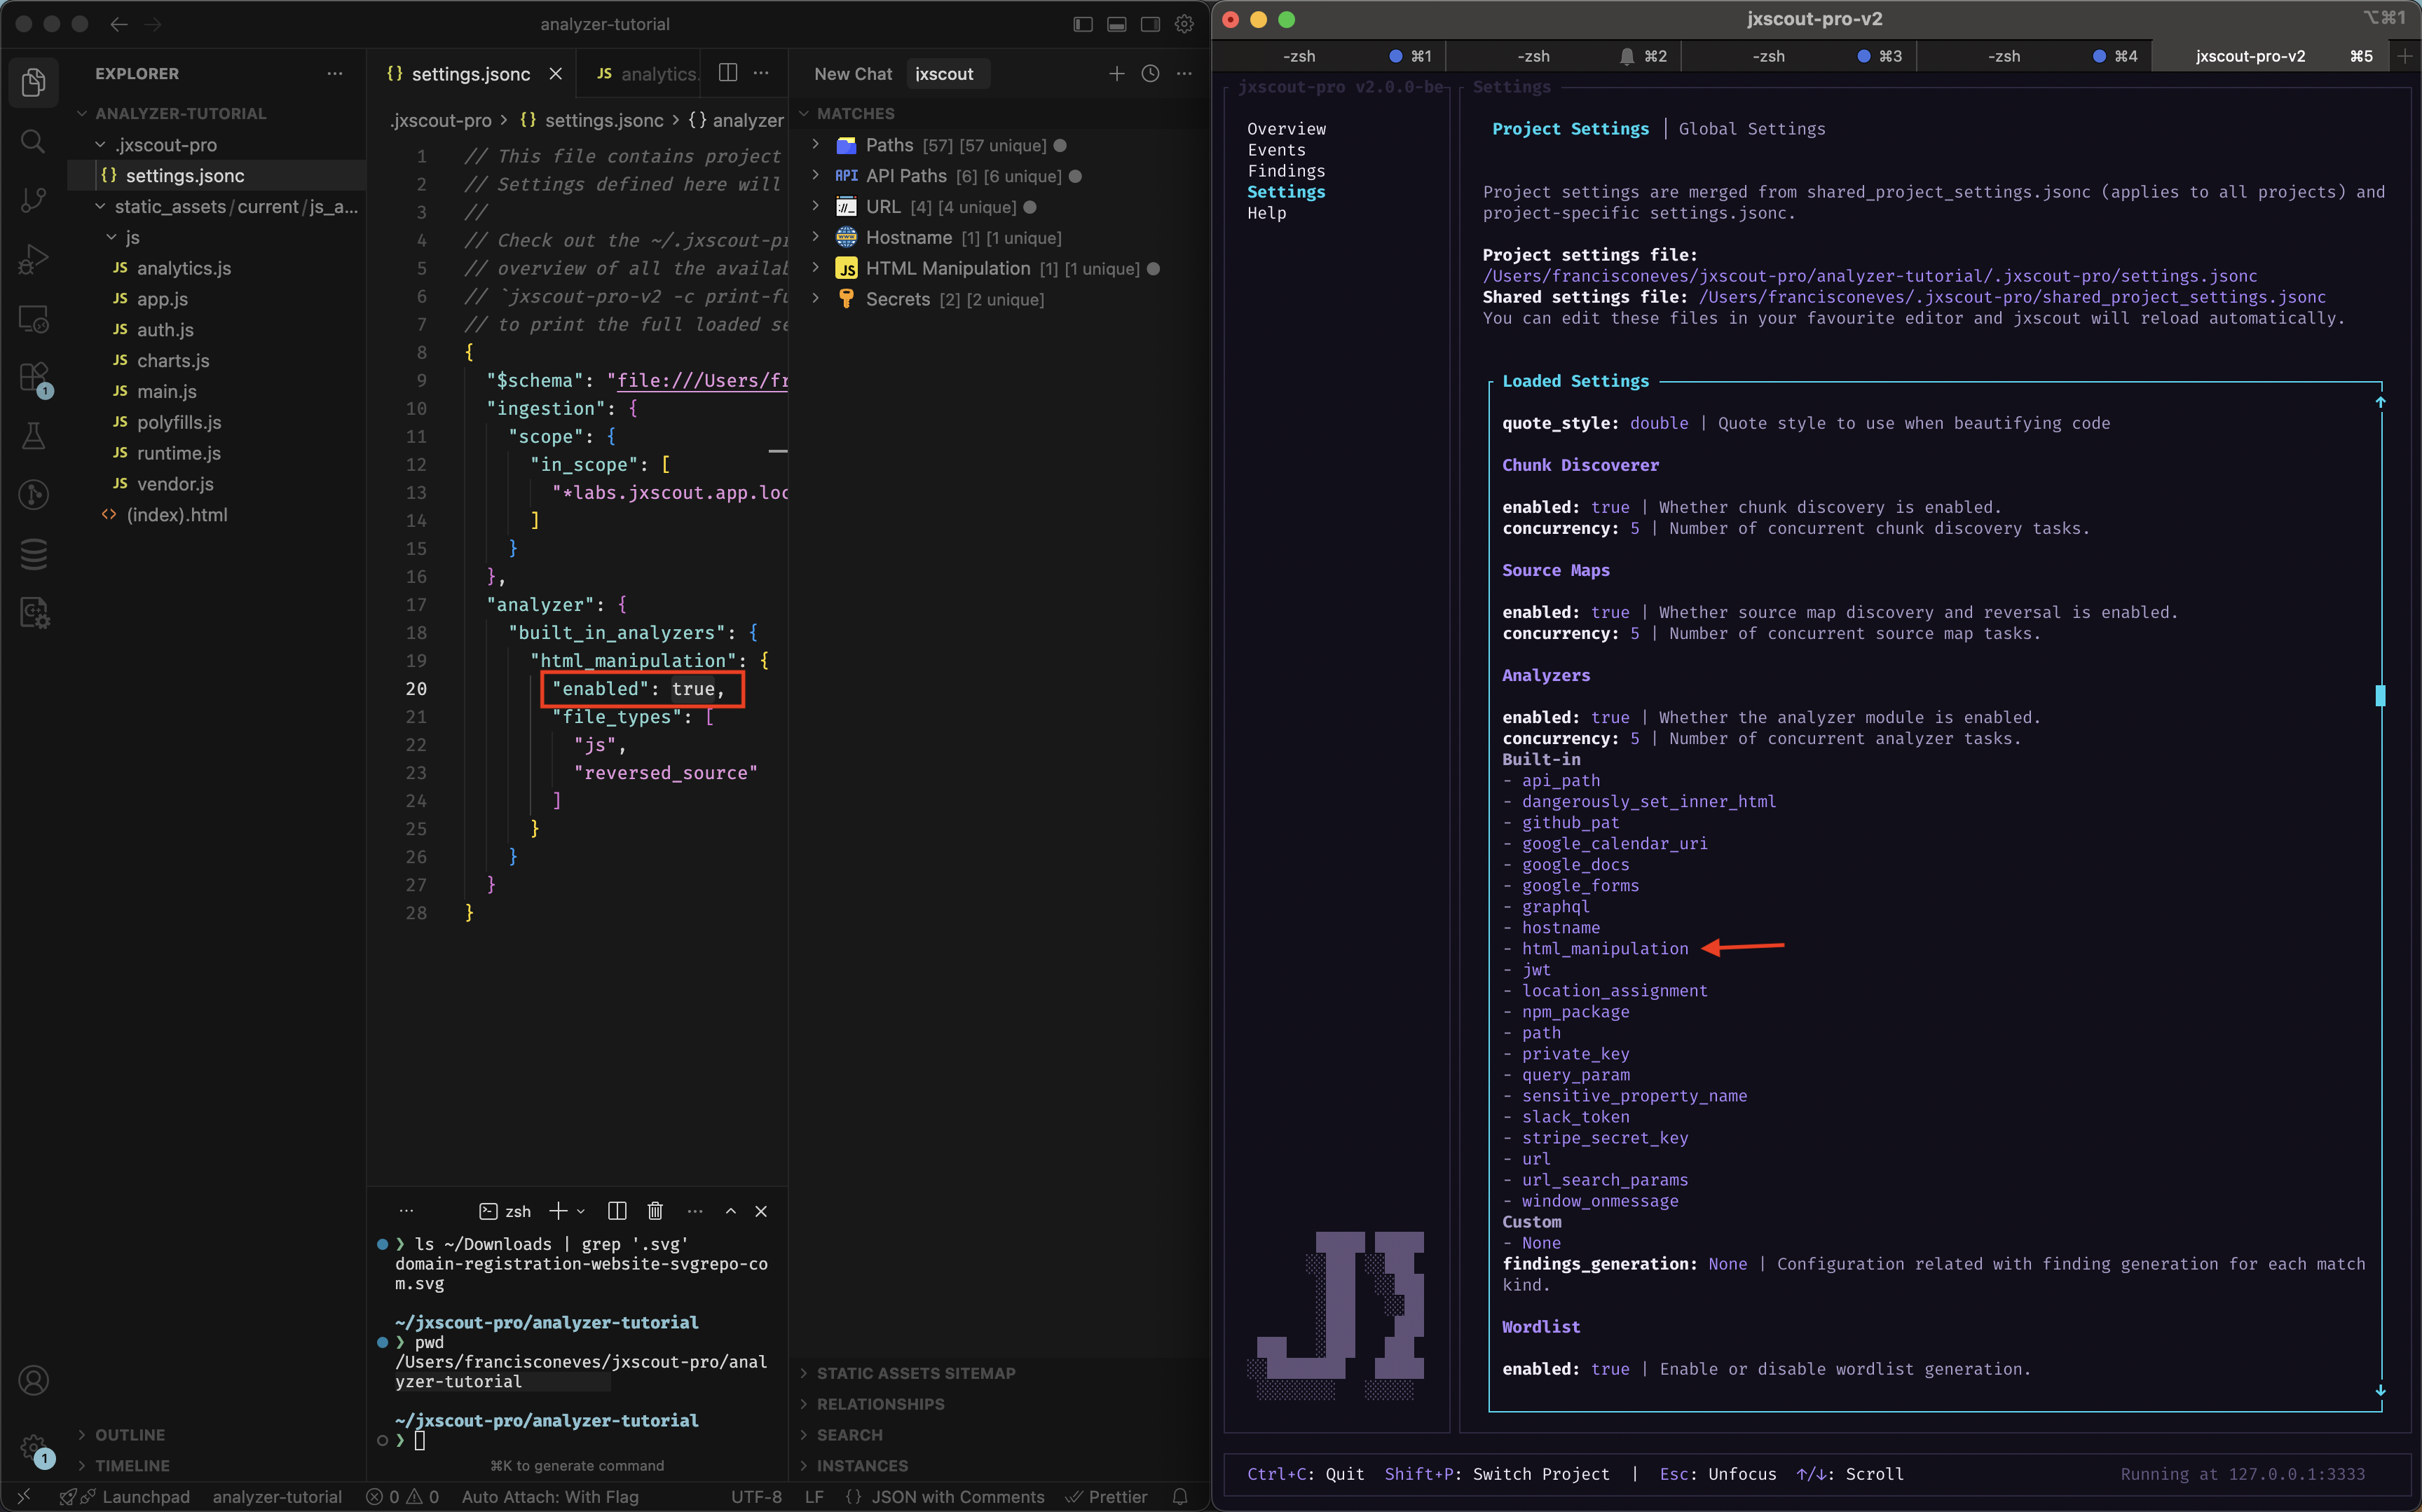
After
Retriggering analysis
At this point you might be wondering why you can still see the "HTML Manipulation" node in the VSCode extension if you just turned off this setting.
jxscout saves matches in the database, which means matches that were already created won't be removed automatically after changing the analyzer configuration. However, as new files are ingested this analyzer won't be used anymore so new matches of this kind wouldn't be generated anymore.
To overcome this limitation, jxscout allows you to retrigger analysis of all files, which will cause matches to be regenerated using your current analyzer configuration.
Let's use this feature on our analyzer-tutorial project with the html_manipulation built-in analyzer turned off and see what happens.
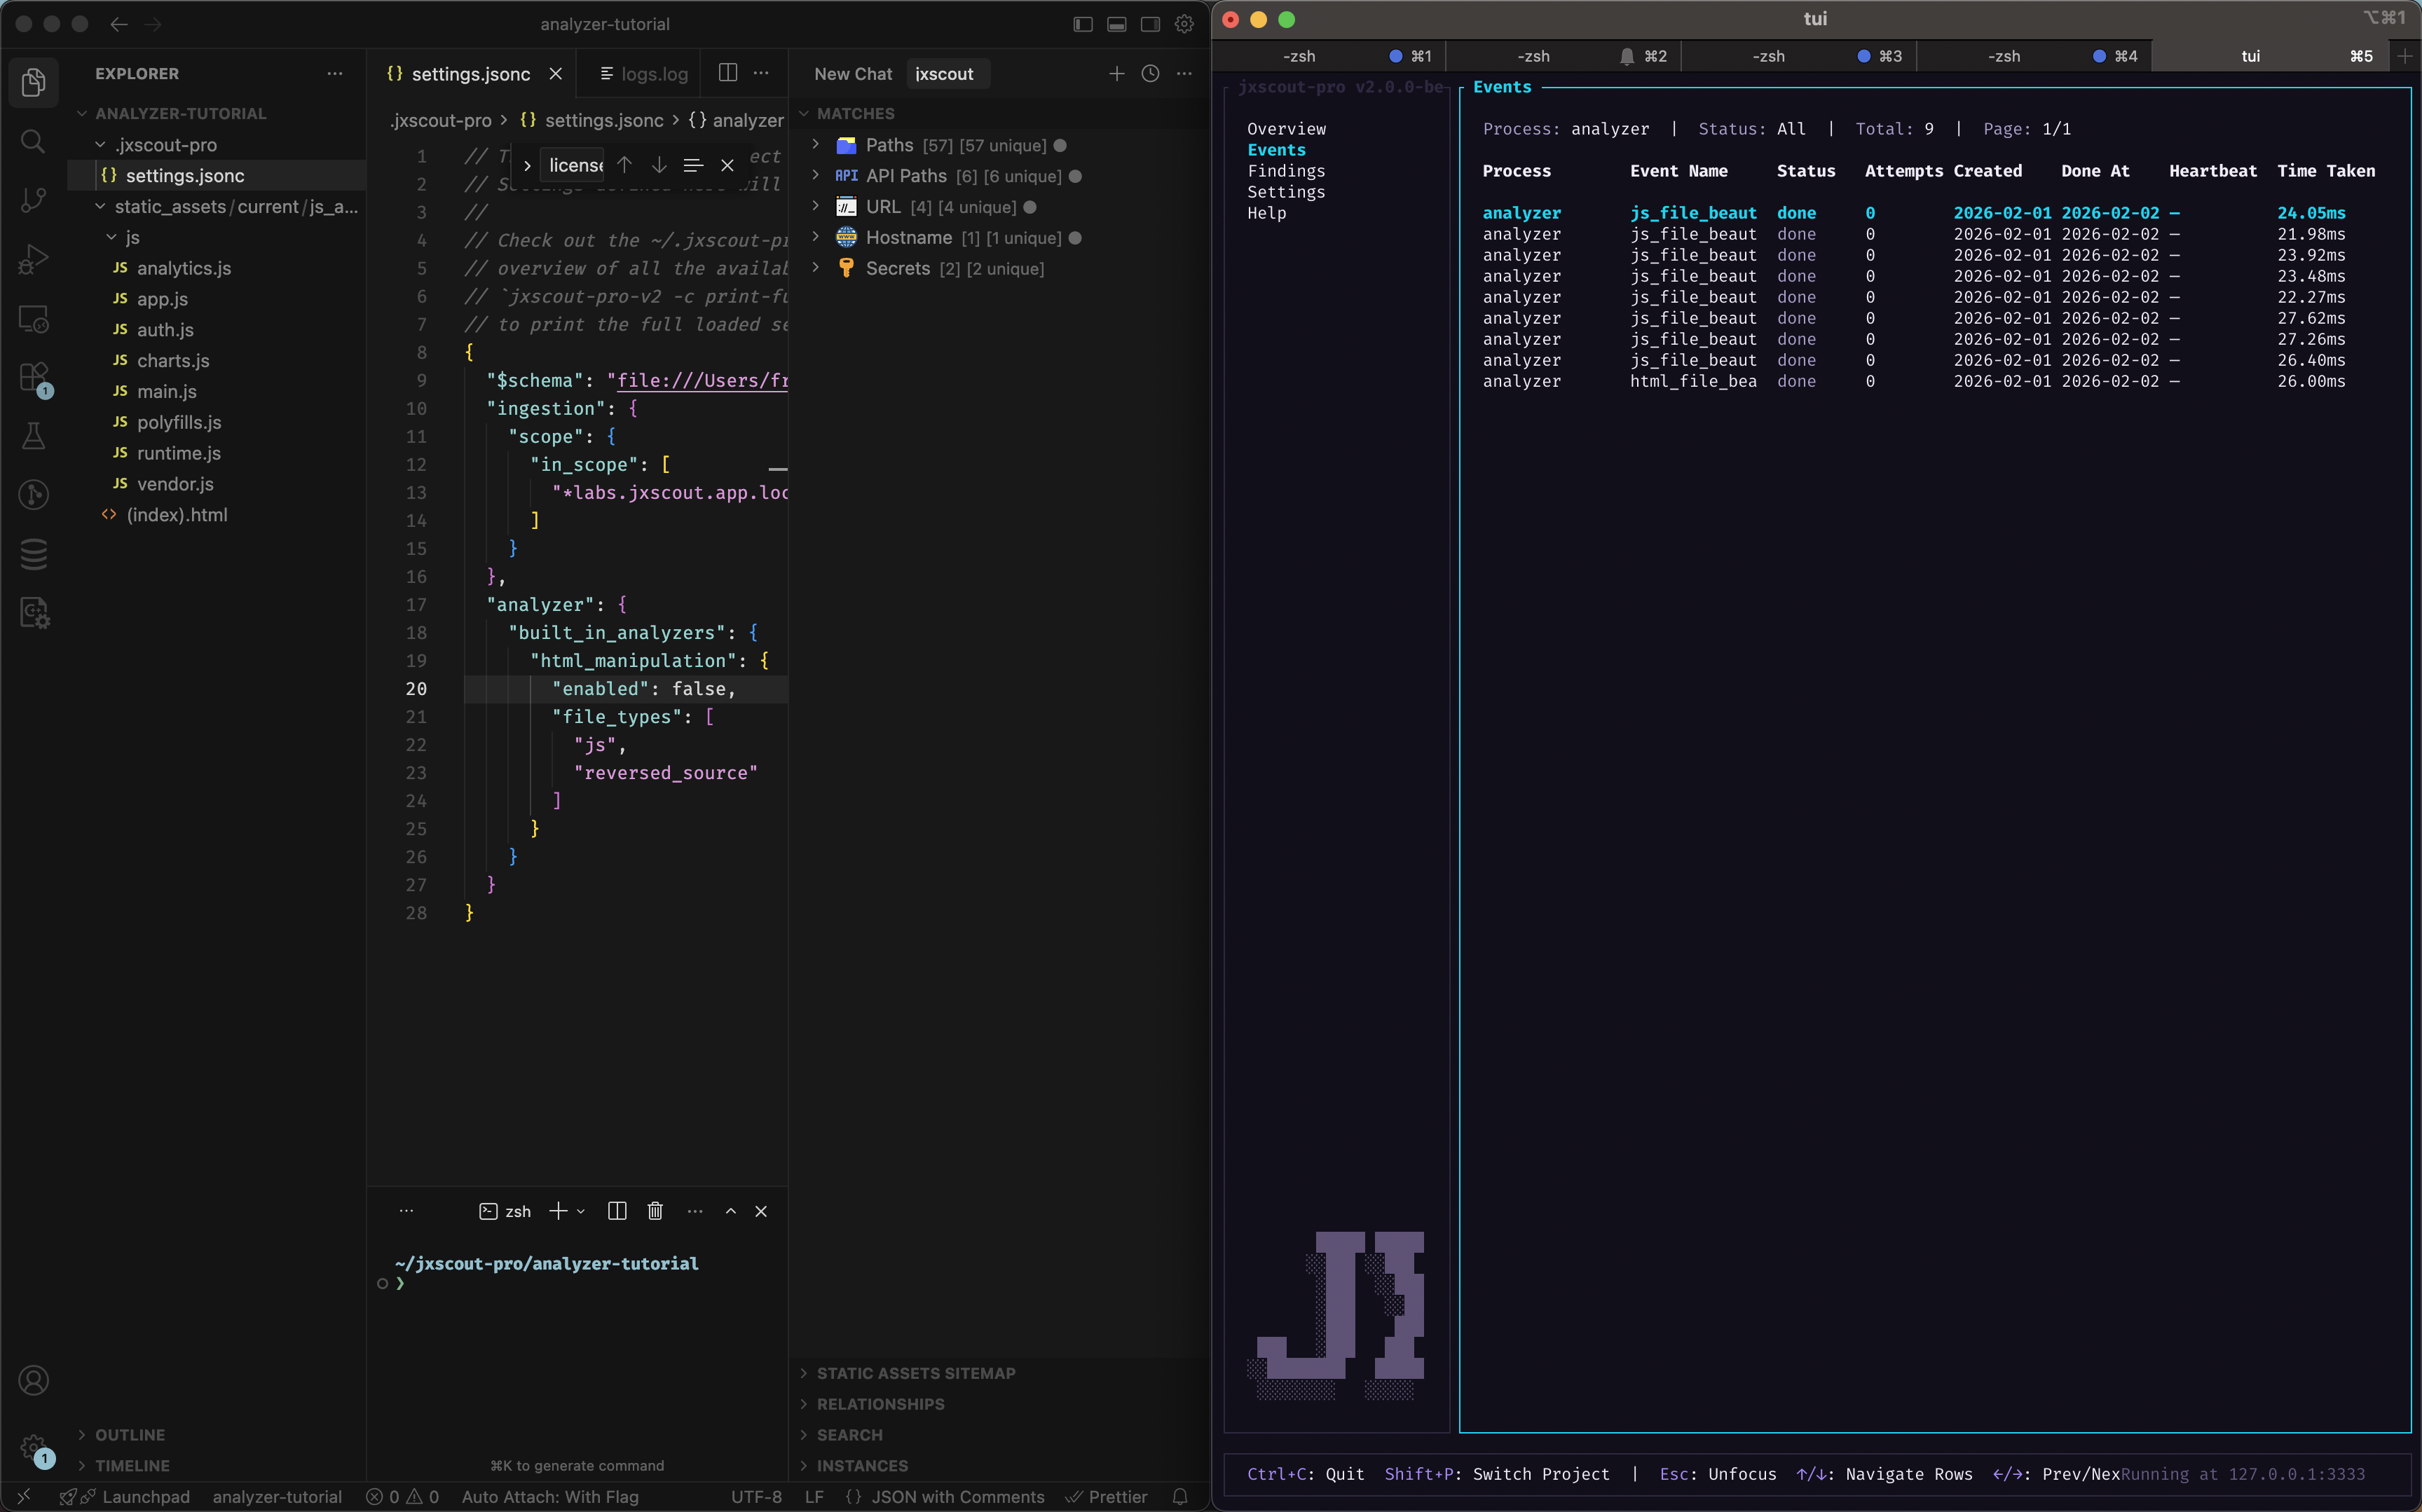
Go to "Events" screen on the CLI, press "Enter" to focus on the table and then press "Shift+R" (you have all shortcuts on the bottom bar). This should open a popup called "Retrigger Events".
Keep analyzer selected, and the other fields as their default values. You have a few options you can configure, for example a file path filter which you can use in case you only want to re-analyze particular files.
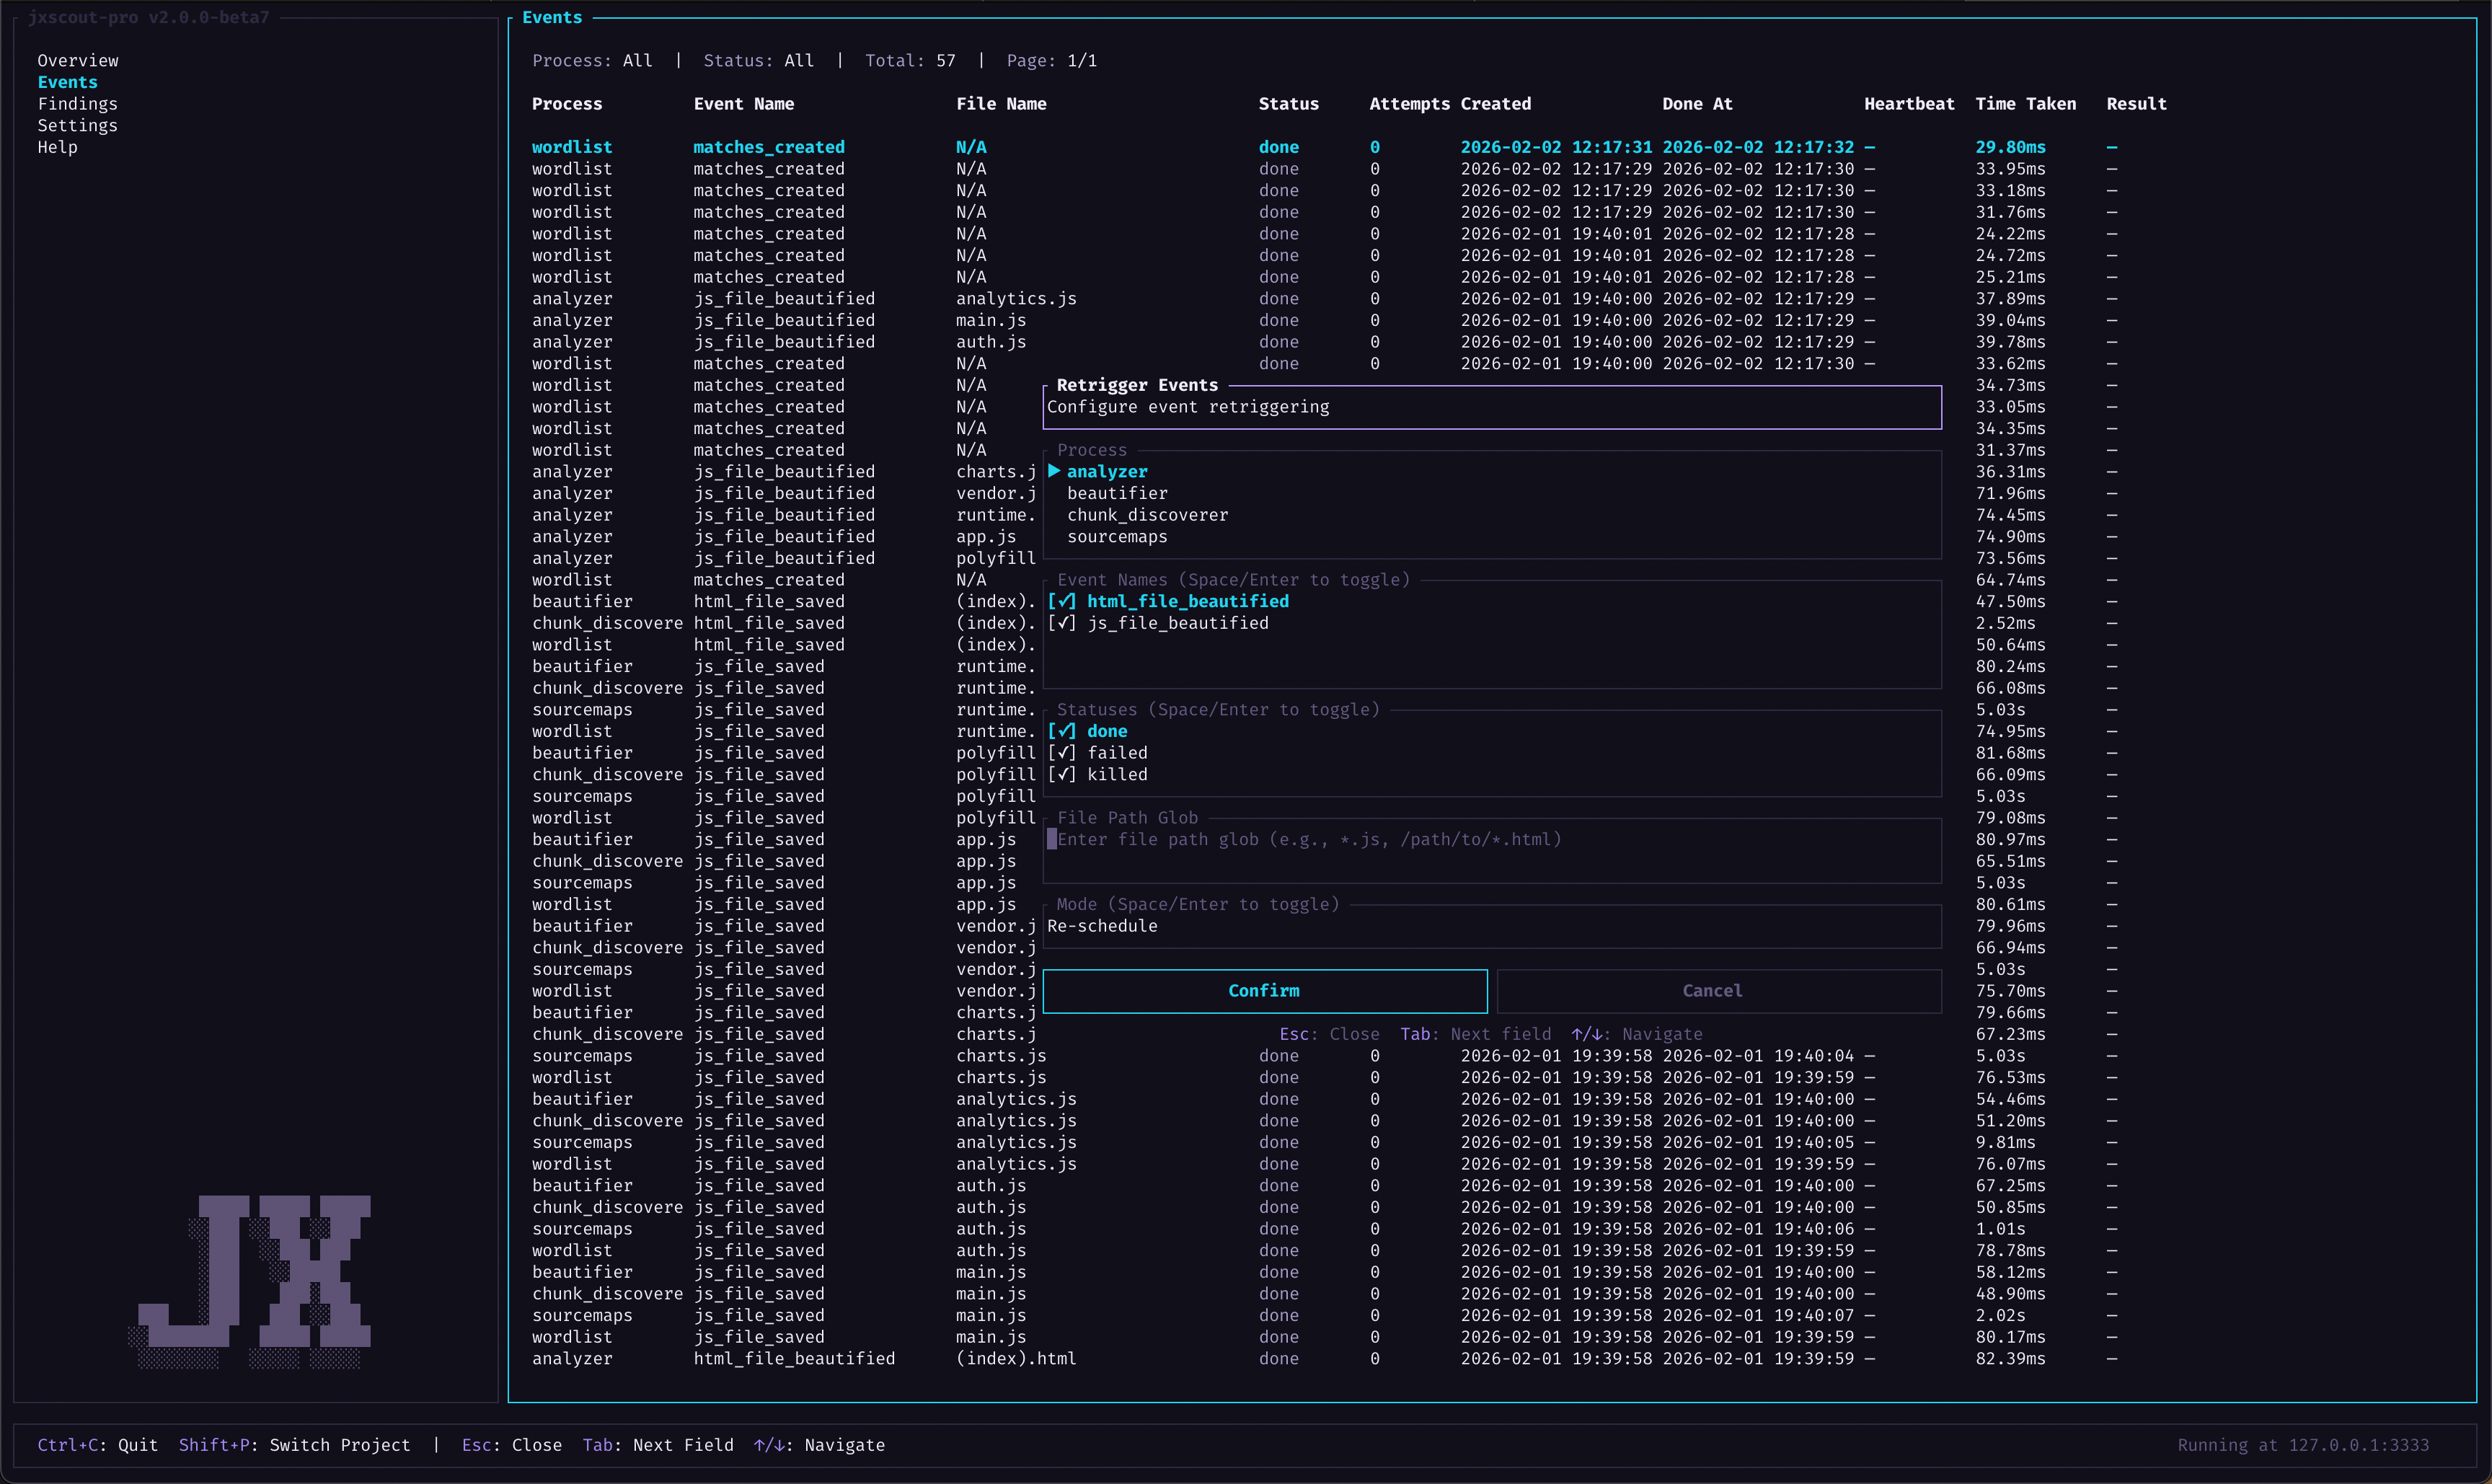
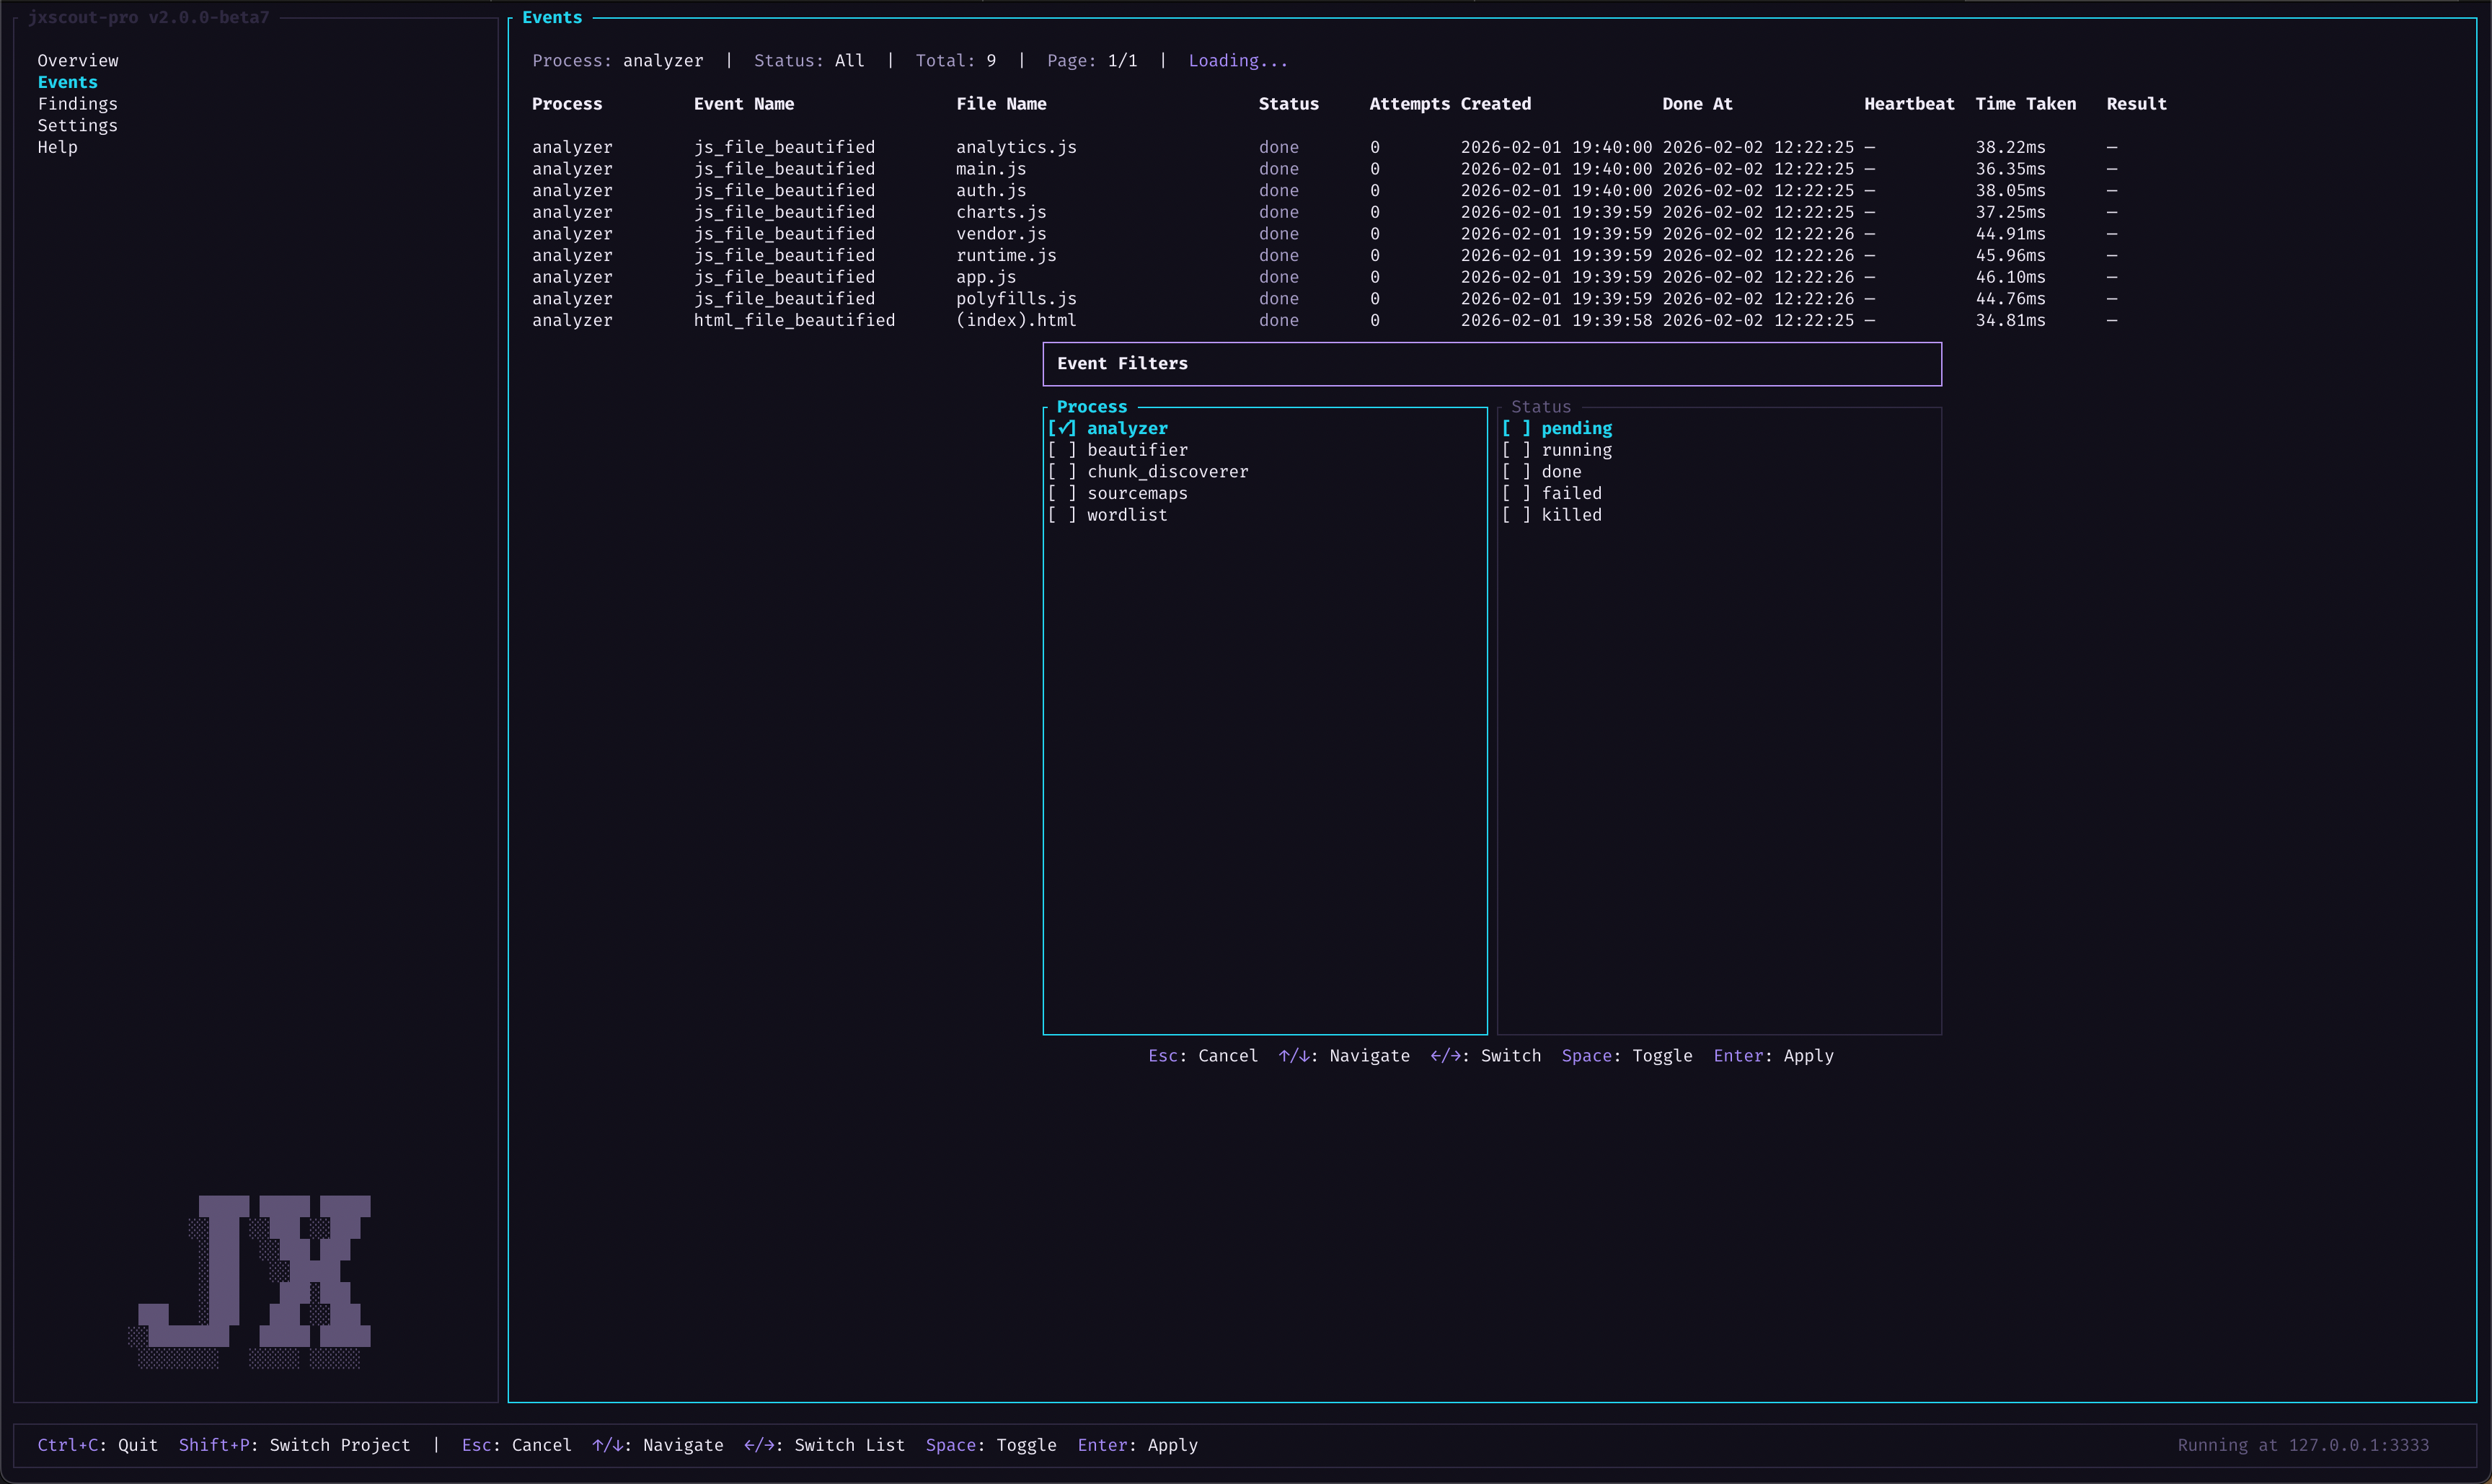
Hit confirm, and the analyzer will run again on all files and regenerate matches. You can see the progress of analysis by using the "f" key and applying a filter for the process analyzer.
After retriggering the analysis, you will notice that the VSCode extension will auto-update and stop showing the "HTML Manipulation" node since those matches were removed.
Ad-hoc testing
Retriggering analysis is useful after you have your analyzer configuration laid out, but sometimes you might want to test your analyzer configuration before retriggering it on your whole project. This will be especially useful when you start building your custom analyzers and you want to check if they are working correctly.
To perform ad-hoc testing, you can use the following command:
$ jxscout-pro-v2 -c analyze --project-name <project_name> --file-type <js|html|reversed_source> /path/to/any/file
This command will run using your current analyzer configuration and output the resulting matches. It's important to note that running this command doesn't add new matches to the database, it just outputs what would be the result. This command is what jxscout uses internally when running the analyzer module.
Another thing to note is that the file-type parameter is used to resolve which analyzers are enabled/disabled for the file being analyzed. Reversed sources are essentially JS files, but since you might want to run different analyzers on reversed sources, jxscout makes this distinction.
Let's try this with the same html_manipulation example. Disable the html_manipulation built-in analyzer like we did before and run:
$ jxscout-pro-v2 -c analyze --project-name analyzer-tutorial --file-type js ~/jxscout-pro/analyzer-tutorial/static_assets/current/js_and_html/labs.jxscout.app/labs/noisy-navigation/js/main.js
This should give you the following output:
{
  "matches_by_analyzer": {
    "path": [
      {
        "kind": "path",
        "value": "/labs/noisy-navigation/frames/",
        "start": {
          "line": 3,
          "column": 14
        },
        "end": {
          "line": 3,
          "column": 46
        }
      }
    ]
  }
}
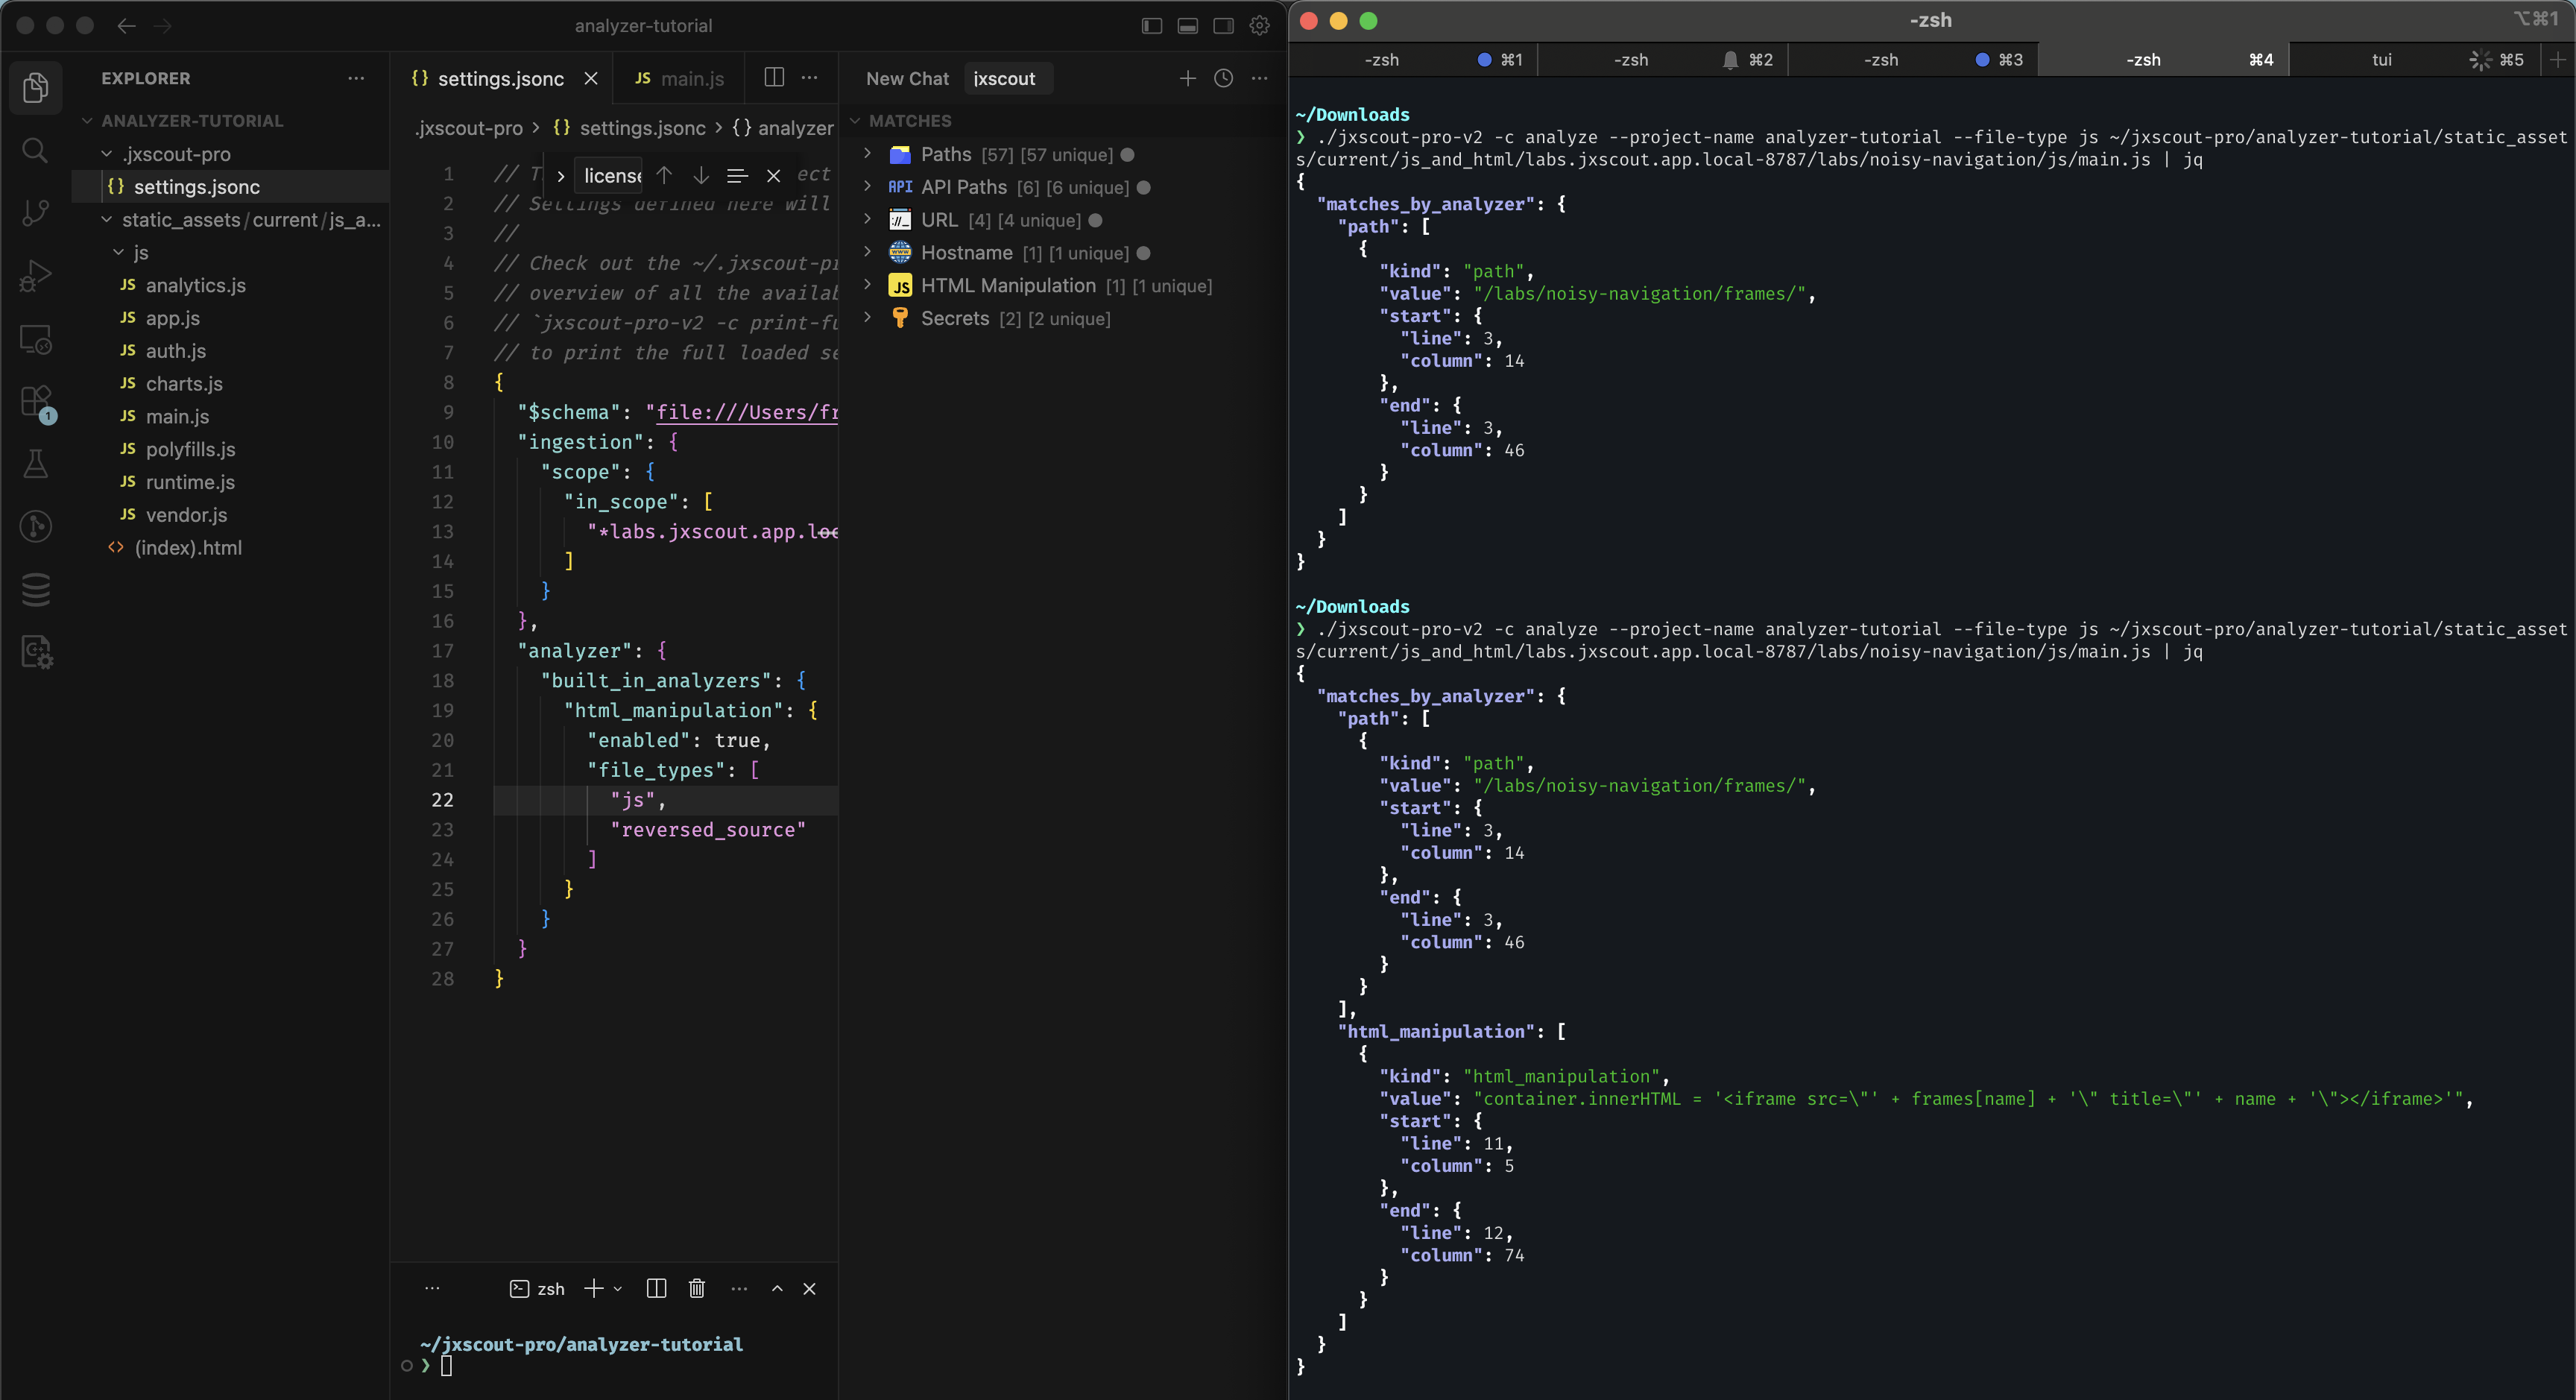
Enable it again and run the analyze command; you should get the following output:
{
  "matches_by_analyzer": {
    "path": [
      {
        "kind": "path",
        "value": "/labs/noisy-navigation/frames/",
        "start": {
          "line": 3,
          "column": 14
        },
        "end": {
          "line": 3,
          "column": 46
        }
      }
    ],
    "html_manipulation": [
      {
        "kind": "html_manipulation",
        "value": "container.innerHTML = '<iframe src=\"' + frames[name] + '\" title=\"' + name + '\"></iframe>'",
        "start": {
          "line": 11,
          "column": 5
        },
        "end": {
          "line": 12,
          "column": 74
        }
      }
    ]
  }
}
Conclusion
With these two methods of testing out and rerunning analyzers, you are now equipped with the right tools to start customizing the built-in jxscout analyzers! After that, we will start writing our own analyzers too.
Preprocess scripts
We already have the tools we need to start making our first customization on the analysis pipeline: introduce a preprocess_script to a built-in analyzer.
A preprocess_script is a configuration that allows you to define an arbitrary script that will be run against each match before being stored on the database.
Preprocess scripts can be used for:
- Implementing additional logic to extract information from matches.
- Preventing certain match values from being stored in the database.
As an example, let's add a preprocess_script to the built-in path analyzer that does the following:
- Prevents
pathmatches that include "node_modules" or the "noisy" keyword from being generated - Transforms paths that start with
/oauth/...to start with/api/v2/oauth/...
The preprocess_script you define will receive the match value in stdin and should output the expected value, or nothing if you want to skip adding that match to the database.
First create a scripts/preprocess_paths.ts inside your project folder with the following contents (this assumes you have bun installed):
const path = (await Bun.stdin.text()).trim();
if (path.includes("node_modules") || path.toLowerCase().includes("noisy")) {
  process.exit(0);
}
const result = path.startsWith("/oauth/")
  ? "/api/v2/oauth" + path.slice(6)
  : path;
console.log(result);
Then let's change our project configuration to add the preprocess script:
{
  // ...
  "analyzer": {
    "built_in_analyzers": {
      "path": {
        "enabled": true,
        "file_types": ["js", "html", "reversed_source"],
        "preprocess_script": "bun run $JXSCOUT_PROJECT_DIR/scripts/preprocess_paths.ts"
      }
    }
  }
  // ...
}
All scripts run by jxscout will have these two env vars available:
JXSCOUT_PROJECT_DIR- the absolute path to the directory of the current projectJXSCOUT_PROJECT_NAME- the current project name
Now let's test our changes by using the method described in the "Ad-hoc testing" section.
After setting the preprocess_script and running the following command, you shouldn't see any more matches containing node_modules.
$ jxscout-pro-v2 -c analyze --project-name analyzer-tutorial --file-type js ~/jxscout-pro/analyzer-tutorial/static_assets/current/js_and_html/labs.jxscout.app/labs/noisy-navigation/js/vendor.js
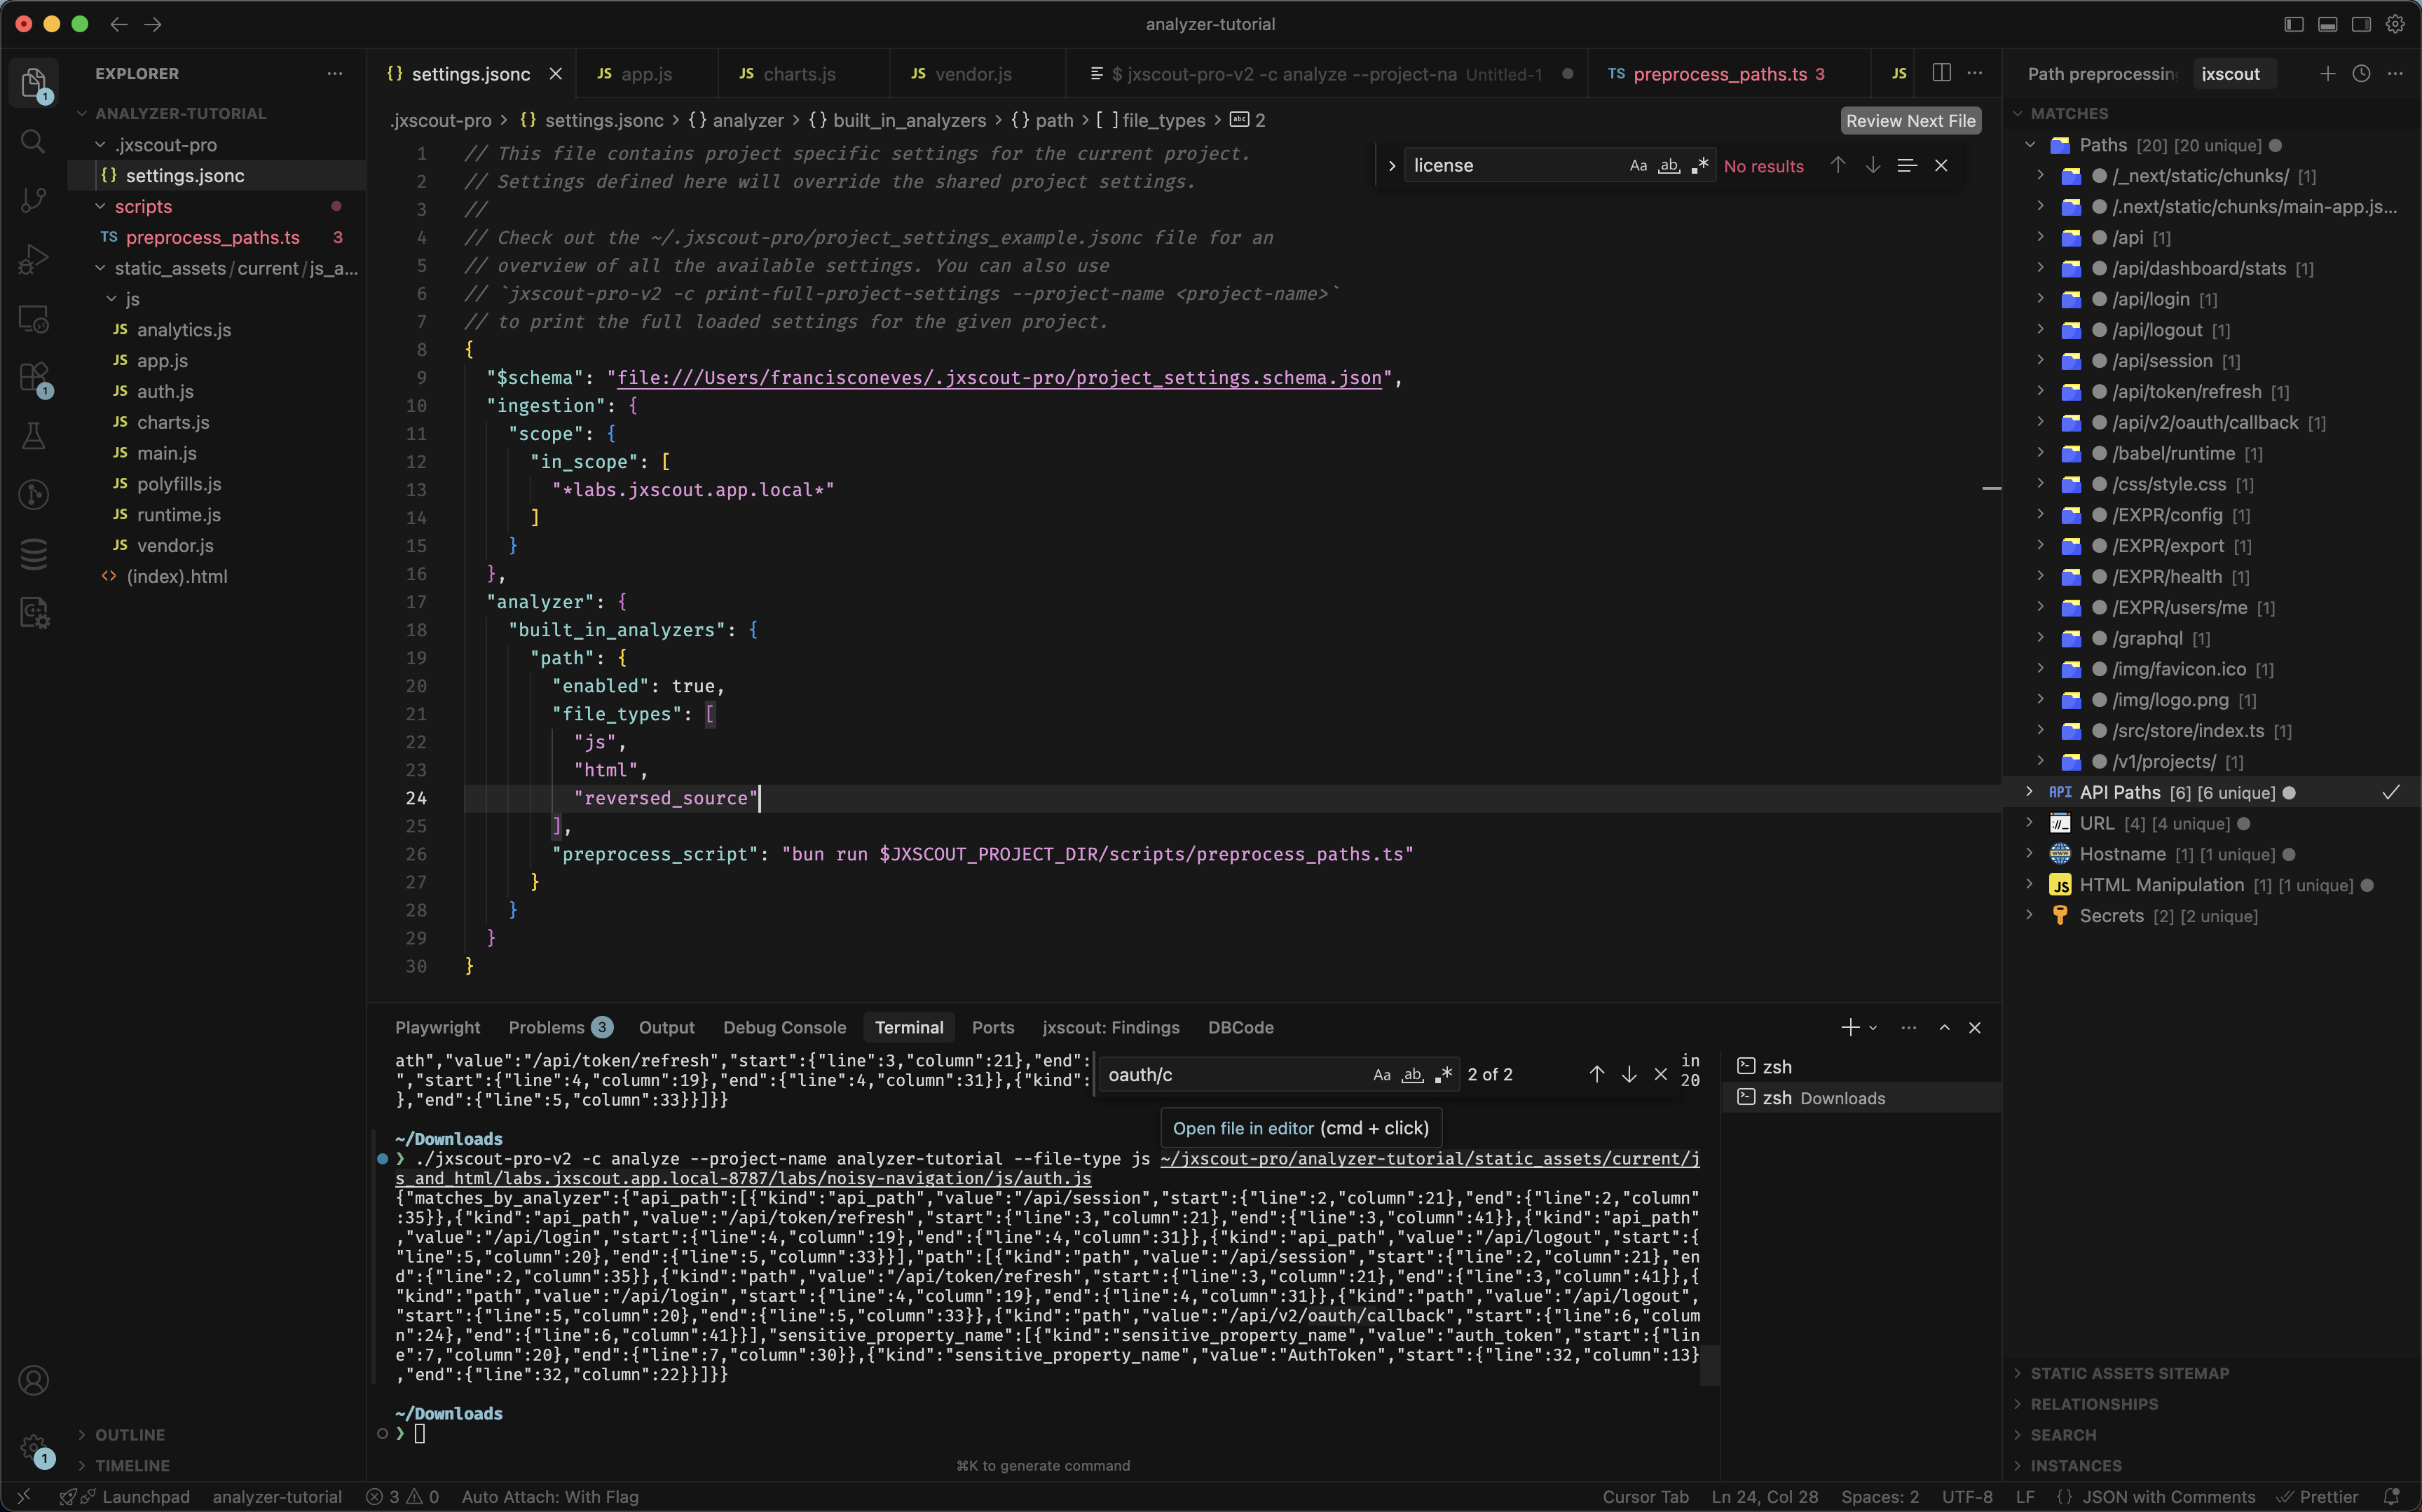
And in the following example, you can see that the original /oauth/callback path got transformed to /api/v2/oauth/callback.
$ jxscout-pro-v2 -c analyze --project-name analyzer-tutorial --file-type js ~/jxscout-pro/analyzer-tutorial/static_assets/current/js_and_html/labs.jxscout.app/labs/noisy-navigation/js/auth.js
Now that we verified that our preprocess_script is working as intended, let's use what we learned in the "Retriggering analysis" section and regenerate our matches, so that we can navigate through them on VSCode.
In the end, you should see something like this:
Skip scripts
A preprocess_script filters individual matches by their value, but sometimes you want to skip analyzing an entire file based on where it came from — its URL or file path. A common example: reversed source maps frequently include third-party code under node_modules, and you may not want any of those files analyzed at all.
The analyzer-level skip_script lets you do exactly that. Unlike a preprocess_script (which runs per match), a skip_script runs once per file, before the file is analyzed, and decides whether to skip it entirely.
The script receives a JSON object on stdin:
{ "file_type": "reversed_source", "url": null, "file_path": "/.../node_modules/react/index.js" }
file_typeis one ofjs,html, orreversed_source.urlis the file's URL when known, ornull. Reversed source files have no URL — for those, thenode_modulessignal lives infile_path.file_pathis the absolute path of the file on disk.
If the script's trimmed stdout equals skip (case-insensitive), the file is not analyzed. Any other output — including empty output — means the file is analyzed as usual. If the script errors (e.g. exits non-zero), jxscout fails open: it analyzes the file anyway and logs a warning, so a broken script never silently drops all analysis.
For reversed source maps, the script is evaluated once per reversed file, so you can skip the node_modules sources while still analyzing the rest.
To skip any file whose path contains node_modules, add a skip_script to your analyzer settings:
{
  // ...
  "analyzer": {
    "skip_script": "jq -r '.file_path' | grep -q node_modules && echo skip || true"
  }
  // ...
}
Or, if you prefer a script file (assuming you have bun installed), create scripts/skip_node_modules.ts:
const { file_path } = await Bun.stdin.json();
if (file_path.includes("node_modules")) {
  console.log("skip");
}
{
  // ...
  "analyzer": {
    "skip_script": "bun run $JXSCOUT_PROJECT_DIR/scripts/skip_node_modules.ts"
  }
  // ...
}
The skip_script runs one subprocess per analyzed file (and once per reversed source file), so prefer lightweight commands like grep/jq over spinning up a heavy interpreter when you have large source maps. When no skip_script is configured, nothing extra runs.
On Windows, scripts run through PowerShell rather than sh, so the POSIX one-liner above won't port directly — use a script file instead.
skip_script is evaluated at analysis time. If you add it after files were already analyzed, their existing matches stay until you regenerate them — use the method from the "Retriggering analysis" section to re-run analysis and clear matches for the now-skipped files.
Custom regex analyzers
It's time to start implementing our first custom analyzer. We will start with the simplest kind of custom analyzer—the custom regex analyzer.
Basically a custom regex analyzer looks like this:
{
  "custom_analyzers": {
    // this is an arbitrary name for your custom analyzer, used by jxscout internally to track
    // whether this analyzer has already run or not
    "my_custom_analyzer_name": {
      "enabled": true,
      // regex analyzers have type `regex`
      "type": "regex",
      // `file_types` where this regex will be applied
      "file_types": ["js", "reversed_source"],
      // `match_kind` for matches generated by this regex
      "match_kind": "my_custom_match_kind",
      // `regex_list` is the list of regexes that will generate matches for this analyzer
      "regex_list": ["my_regex_pattern", "my_other_regex_pattern"]
    }
  }
}
As an exercise, let's create a custom regex analyzer that finds usages of fetch(...). Let's update our project settings and add the following config:
{
  // ...
  "analyzer": {
    // ...
    "custom_analyzers": {
      "fetch_calls": {
        "enabled": true,
        "type": "regex",
        "file_types": ["js", "reversed_source"],
        "match_kind": "fetch_call",
        "regex_list": ["fetch\\s*\\("]
      }
    }
    // ...
  }
}
Then let's use the following command to test that our regex is matching correctly:
$ jxscout-pro-v2 -c analyze --project-name analyzer-tutorial --file-type js ~/jxscout-pro/analyzer-tutorial/static_assets/current/js_and_html/labs.jxscout.app/labs/noisy-navigation/js/app.js
The output should include something like the following, meaning that our regex analyzer is working correctly!
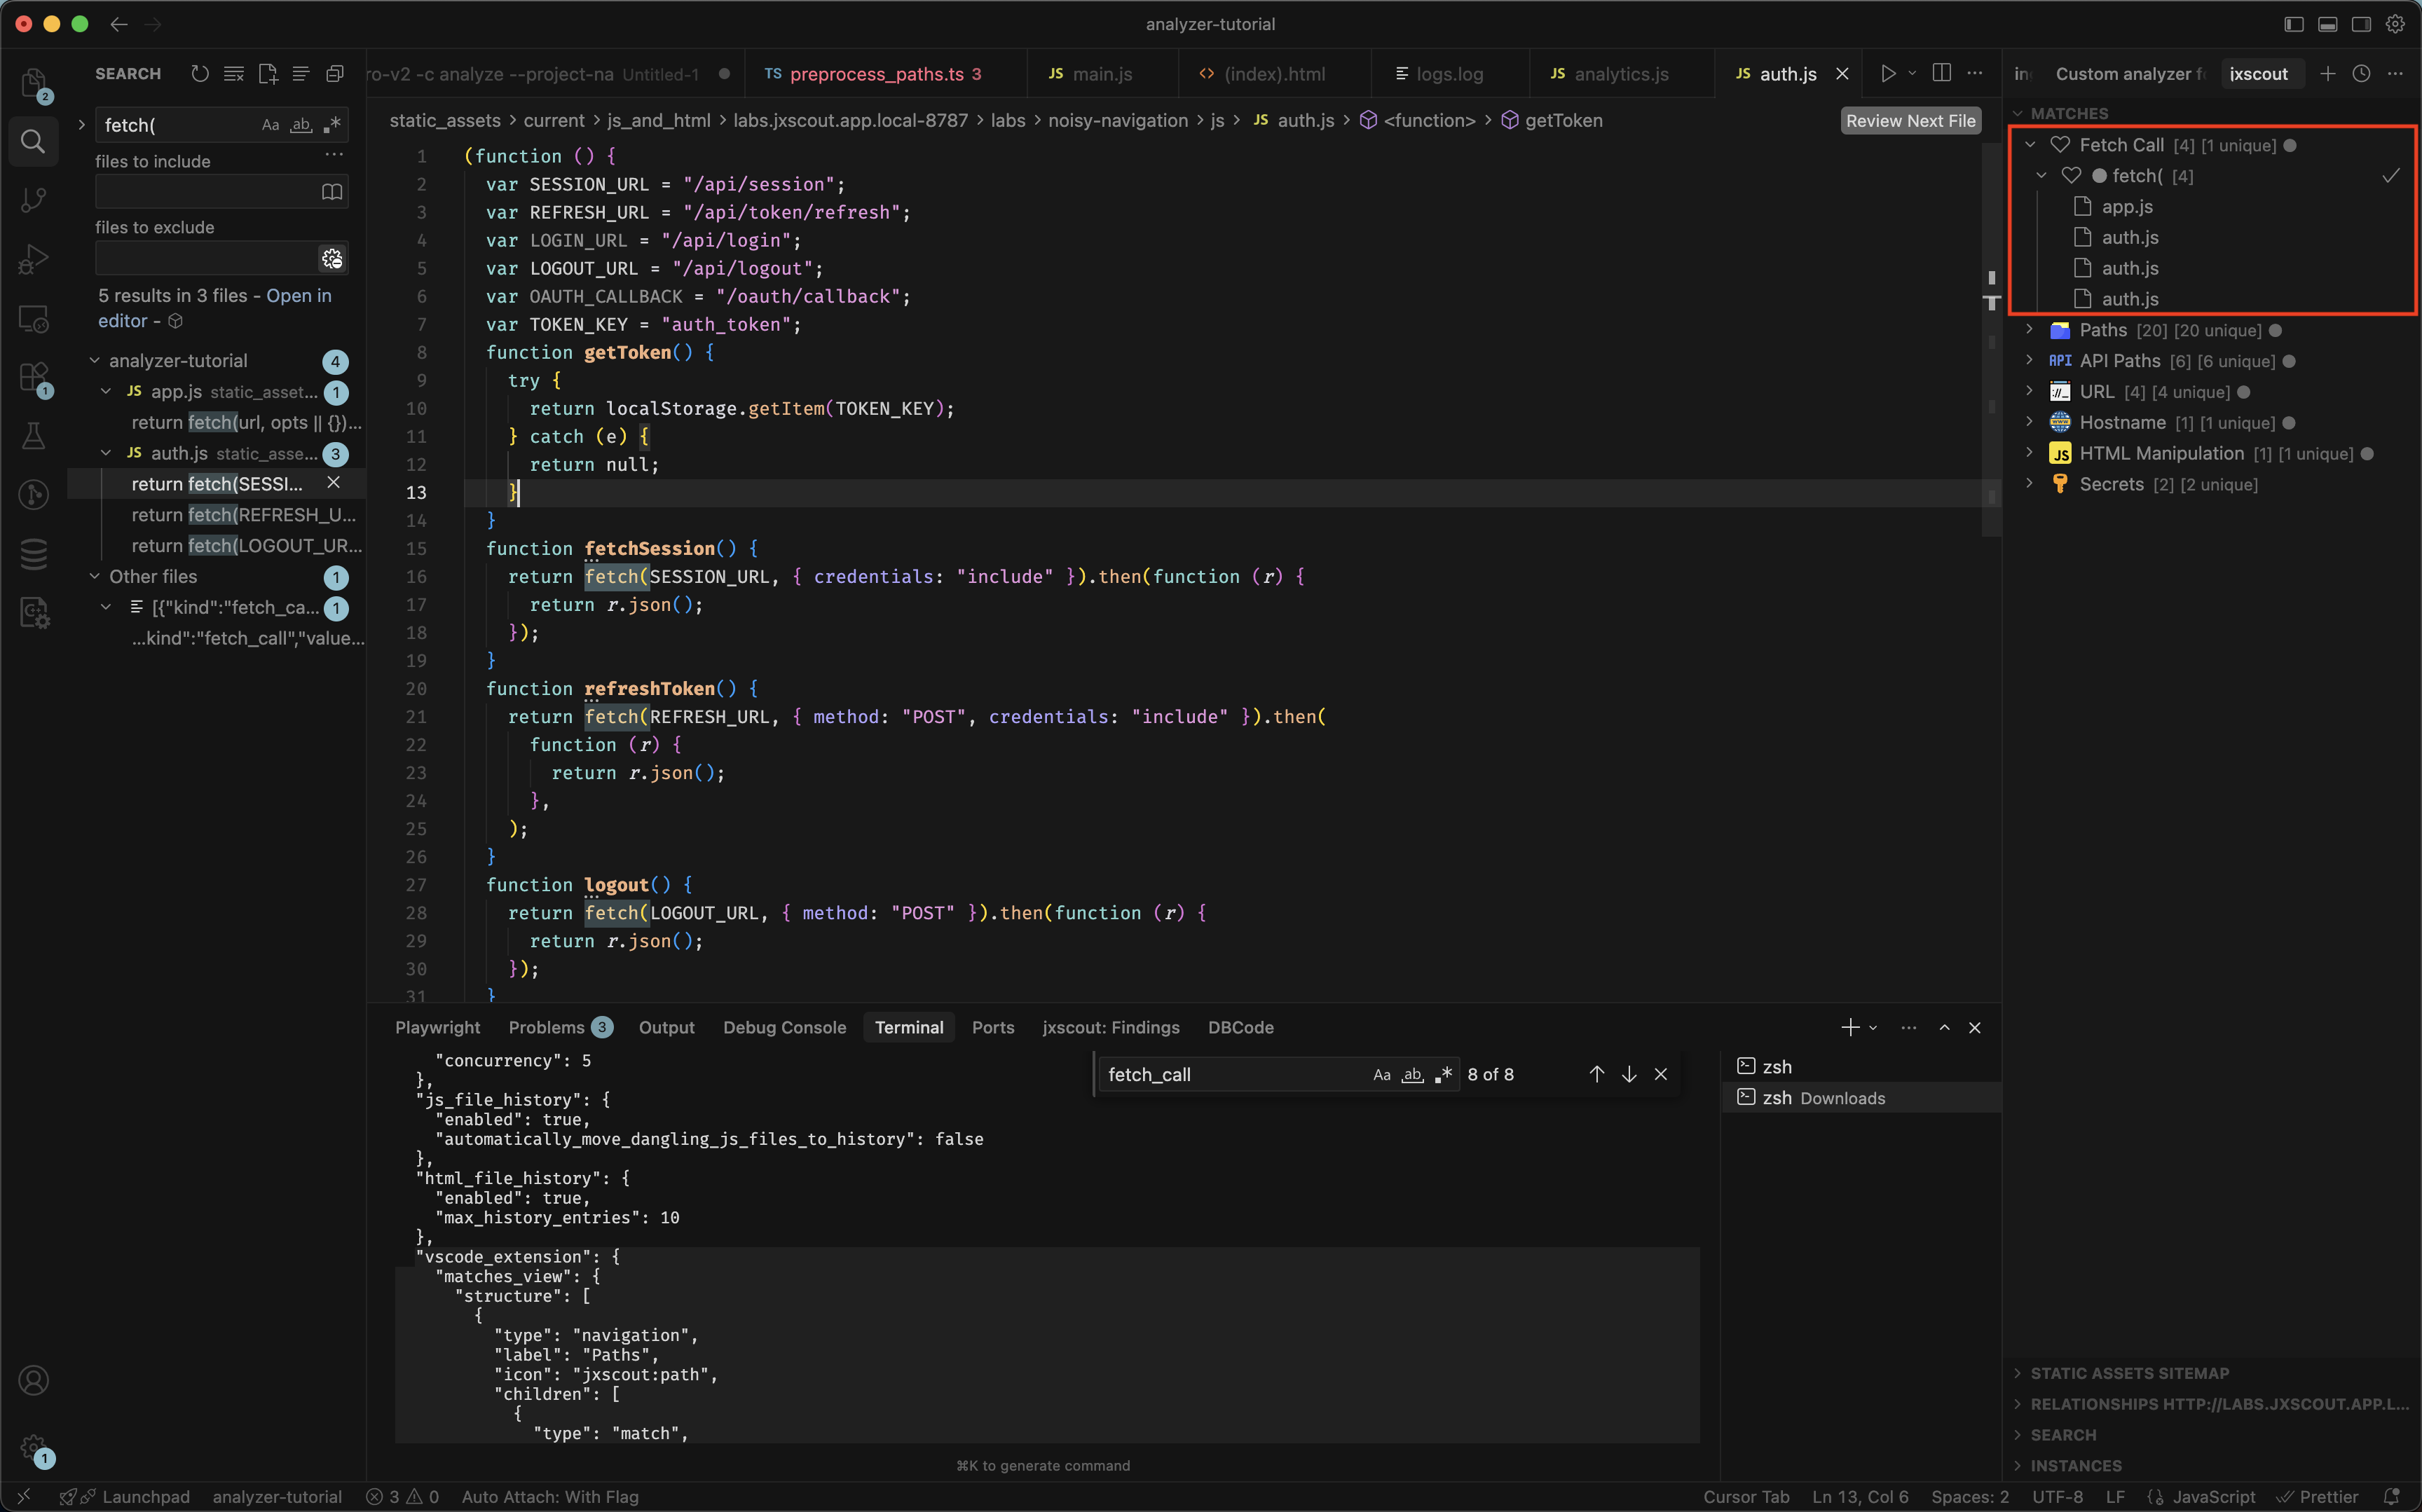
[{"kind":"fetch_call","value":"fetch(","start":{"line":15,"column":12},"end":{"line":15,"column":18}}]
Let's now retrigger the analyzer events like we did before so that matches of this new kind are generated. After we do that we are just missing one step to show this new match kind in VSCode: update the VSCode matches view structure like we learned before.
Let's use what we learned in that section and add a new node to show our new fetch_call matches.
{
  // ...
  "vscode_extension": {
    "matches_view": {
      "structure": [
        {
          "type": "navigation",
          "label": "Fetch Call",
          "icon": "vscode:heart",
          "children": [
            {
              "type": "match",
              "match_kind": "fetch_call",
              "icon": "vscode:heart"
            }
          ]
        }
      ]
    }
  }
  // ...
}
Since extend_default_structure defaults to true, you only need to add your custom entry — it gets merged with the built-in structure automatically.
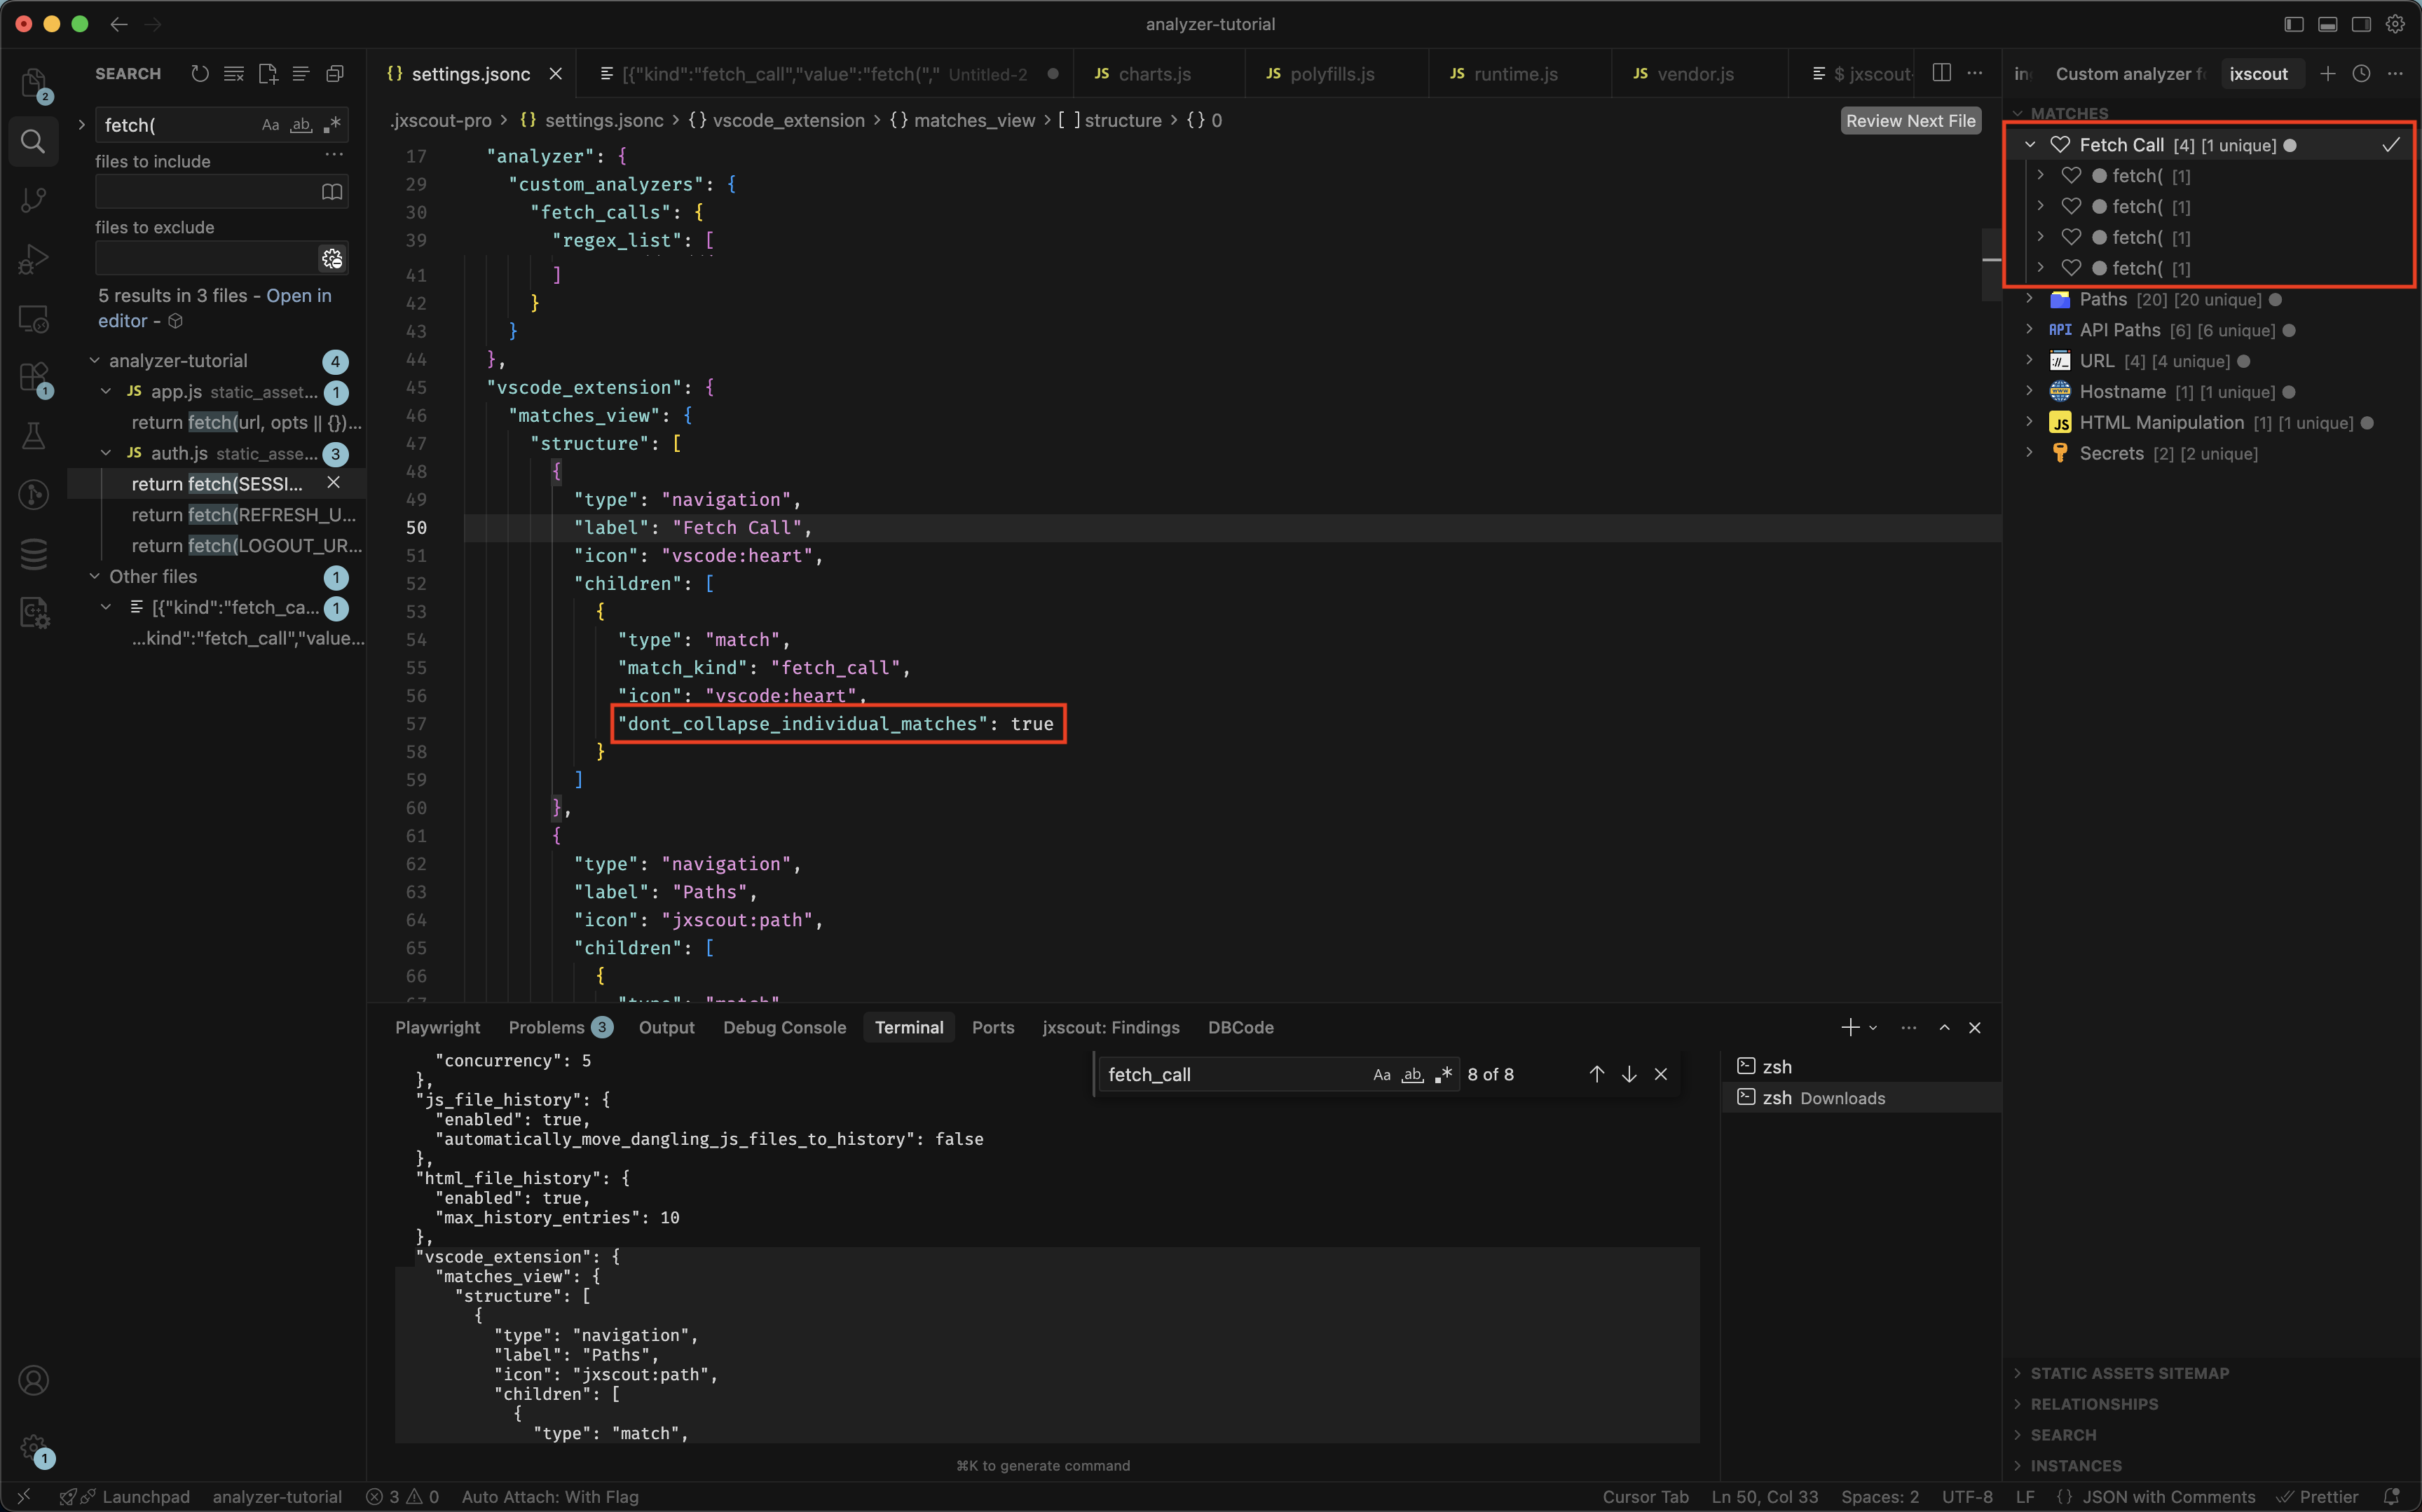
In the end, your VSCode Matches view should look like this:
If you prefer to have each fetch call shown separately instead of collapsed by value, you can use the dont_collapse_individual_matches option:
{
  // ...
  "vscode_extension": {
    "matches_view": {
      "structure": [
        {
          "type": "navigation",
          "label": "Fetch Call",
          "icon": "vscode:heart",
          "children": [
            {
              "type": "match",
              "match_kind": "fetch_call",
              "icon": "vscode:heart",
              "dont_collapse_individual_matches": true // we added this
            }
          ]
        }
      ]
    }
  }
  // ...
}
And you should get the following view:
Custom derived analyzers
Sometimes you might want to pay special attention to specific values that could be derived from other match kinds. A good example of this is path values, which might contain some keywords that indicate they might be sensitive. An easy way to create new matches for this kind of value is to use custom derived analyzers. Let's take a look at how they work.
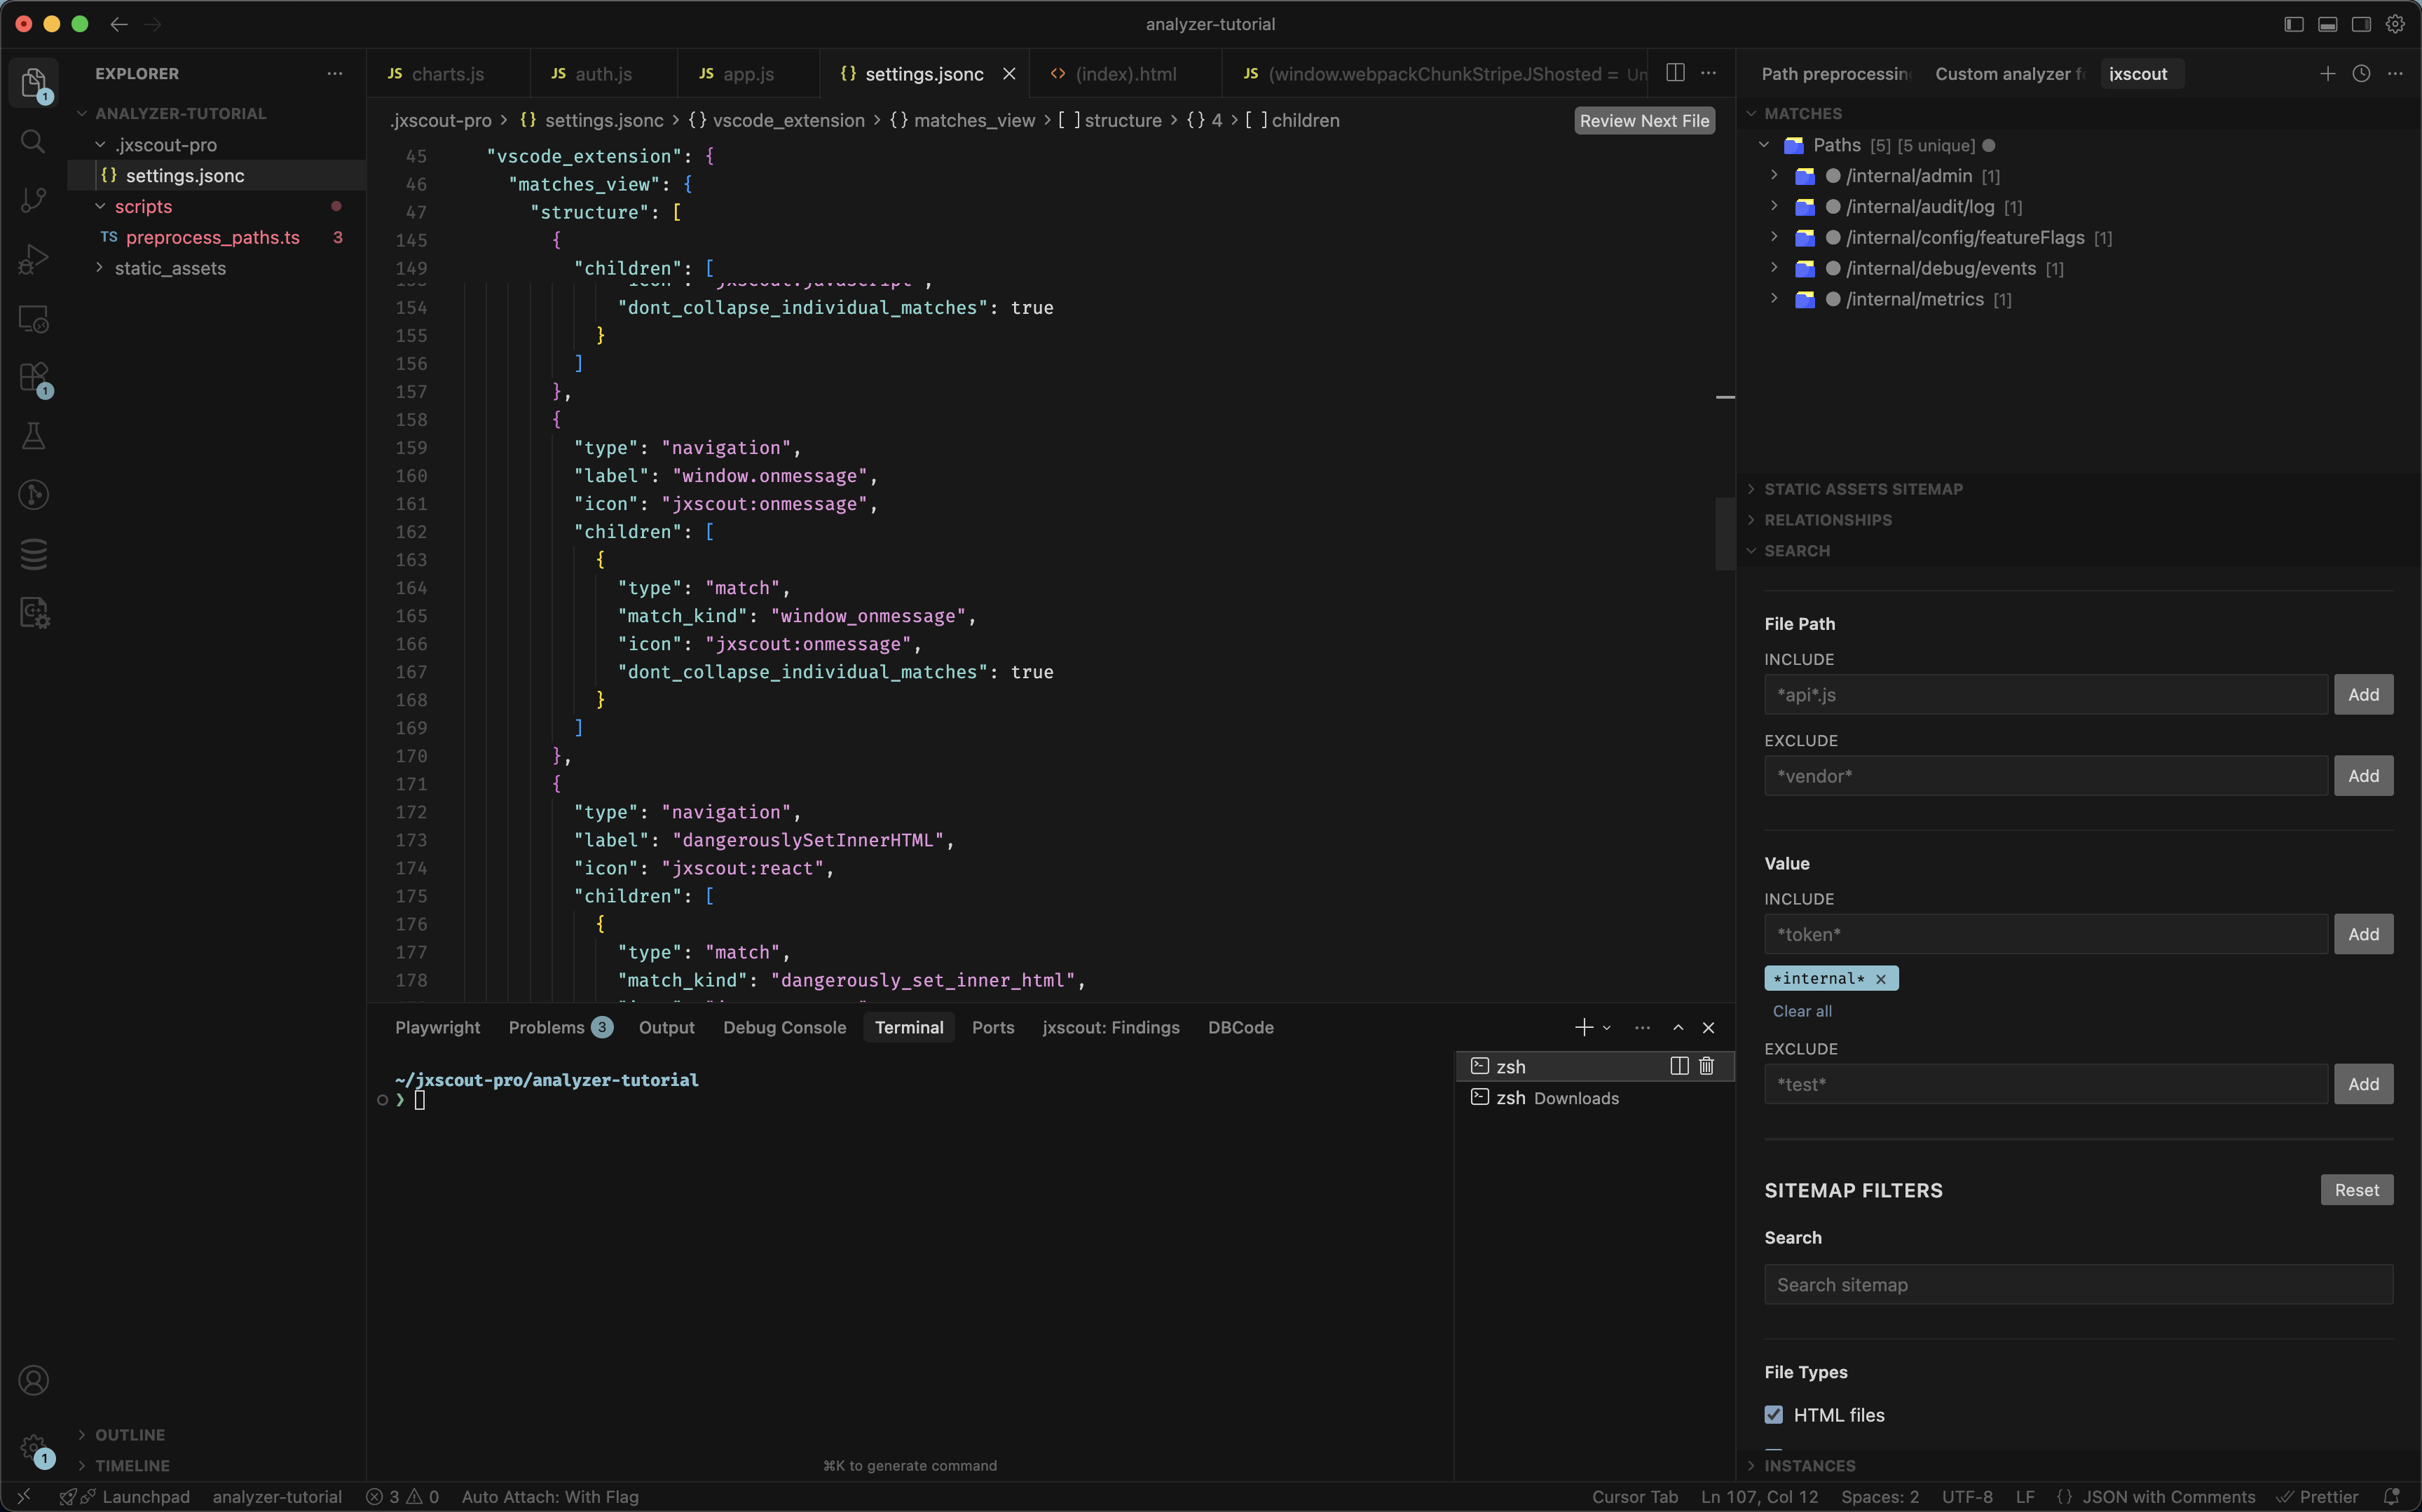
Let's open this lab page https://labs.jxscout.app/labs/noisy-navigation/frames/report. You will notice that jxscout detected some /internal paths. You could filter matches manually like we did in the image below, but that doesn't give you the visual cue that a new navigation node in the Matches view would give you.
Let's see how custom derived analyzers can help us implement a new match kind for internal_path. There are actually two ways we could implement this with custom derived analyzers, and we will check both. Let's add the following to our project settings, under analyzer > custom_analyzers:
{
  // ...
  "custom_analyzers": {
    // one way to implement this is to use a derived analyzer with a `regex_list`
    "internal_paths": {
      "enabled": true,
      "type": "derived",
      "file_types": ["html", "js", "reversed_source"],
      // this is the original match kind from where we want to derive a new match kind
      "original_match_kind": "path",
      // the name of the new match kind
      "new_match_kind": "internal_path",
      // a list of regexes that will be applied to the original value. if there's any match
      // then a new match of the `new_match_kind` will be generated
      "regex_list": [".*internal.*"]
    },
    "internal_paths_with_preprocess": {
      "enabled": true,
      "type": "derived",
      "file_types": ["html", "js", "reversed_source"],
      "original_match_kind": "path",
      "new_match_kind": "internal_path_preprocess",
      // you could always leave the `regex_list` empty
      "regex_list": [],
      // and use a preprocess script to implement a similar functionality
      "preprocess_script": "grep -F internal"
    }
    // ...
  }
  // ...
}
Let's test that our derived analyzers are working correctly:
$ jxscout-pro-v2 -c analyze --project-name analyzer-tutorial --file-type js ~/jxscout-pro/analyzer-tutorial/static_assets/current/js_and_html/labs.jxscout.app/labs/noisy-navigation/js/admin.js
The output should show you some new matches of the kinds internal_path and internal_path_preprocess, meaning that our custom analyzers are working correctly!
Let's now add a node to the VSCode matches view to display these two new match kinds. Since extend_default_structure defaults to true, we only need to add our custom entries — they get merged with the built-in structure automatically:
{
  // ...
  "vscode_extension": {
    "matches_view": {
      "structure": [
        {
          "type": "navigation",
          "label": "Internal Path",
          "icon": "vscode:heart",
          "children": [
            {
              "type": "match",
              "match_kind": "internal_path",
              "icon": "vscode:heart"
            }
          ]
        },
        {
          "type": "navigation",
          "label": "Internal Path Preprocess",
          "icon": "vscode:heart",
          "children": [
            {
              "type": "match",
              "match_kind": "internal_path_preprocess",
              "icon": "vscode:heart"
            }
          ]
        }
      ]
    }
  }
}
And now just retrigger analysis on your project so new matches are stored in the database.
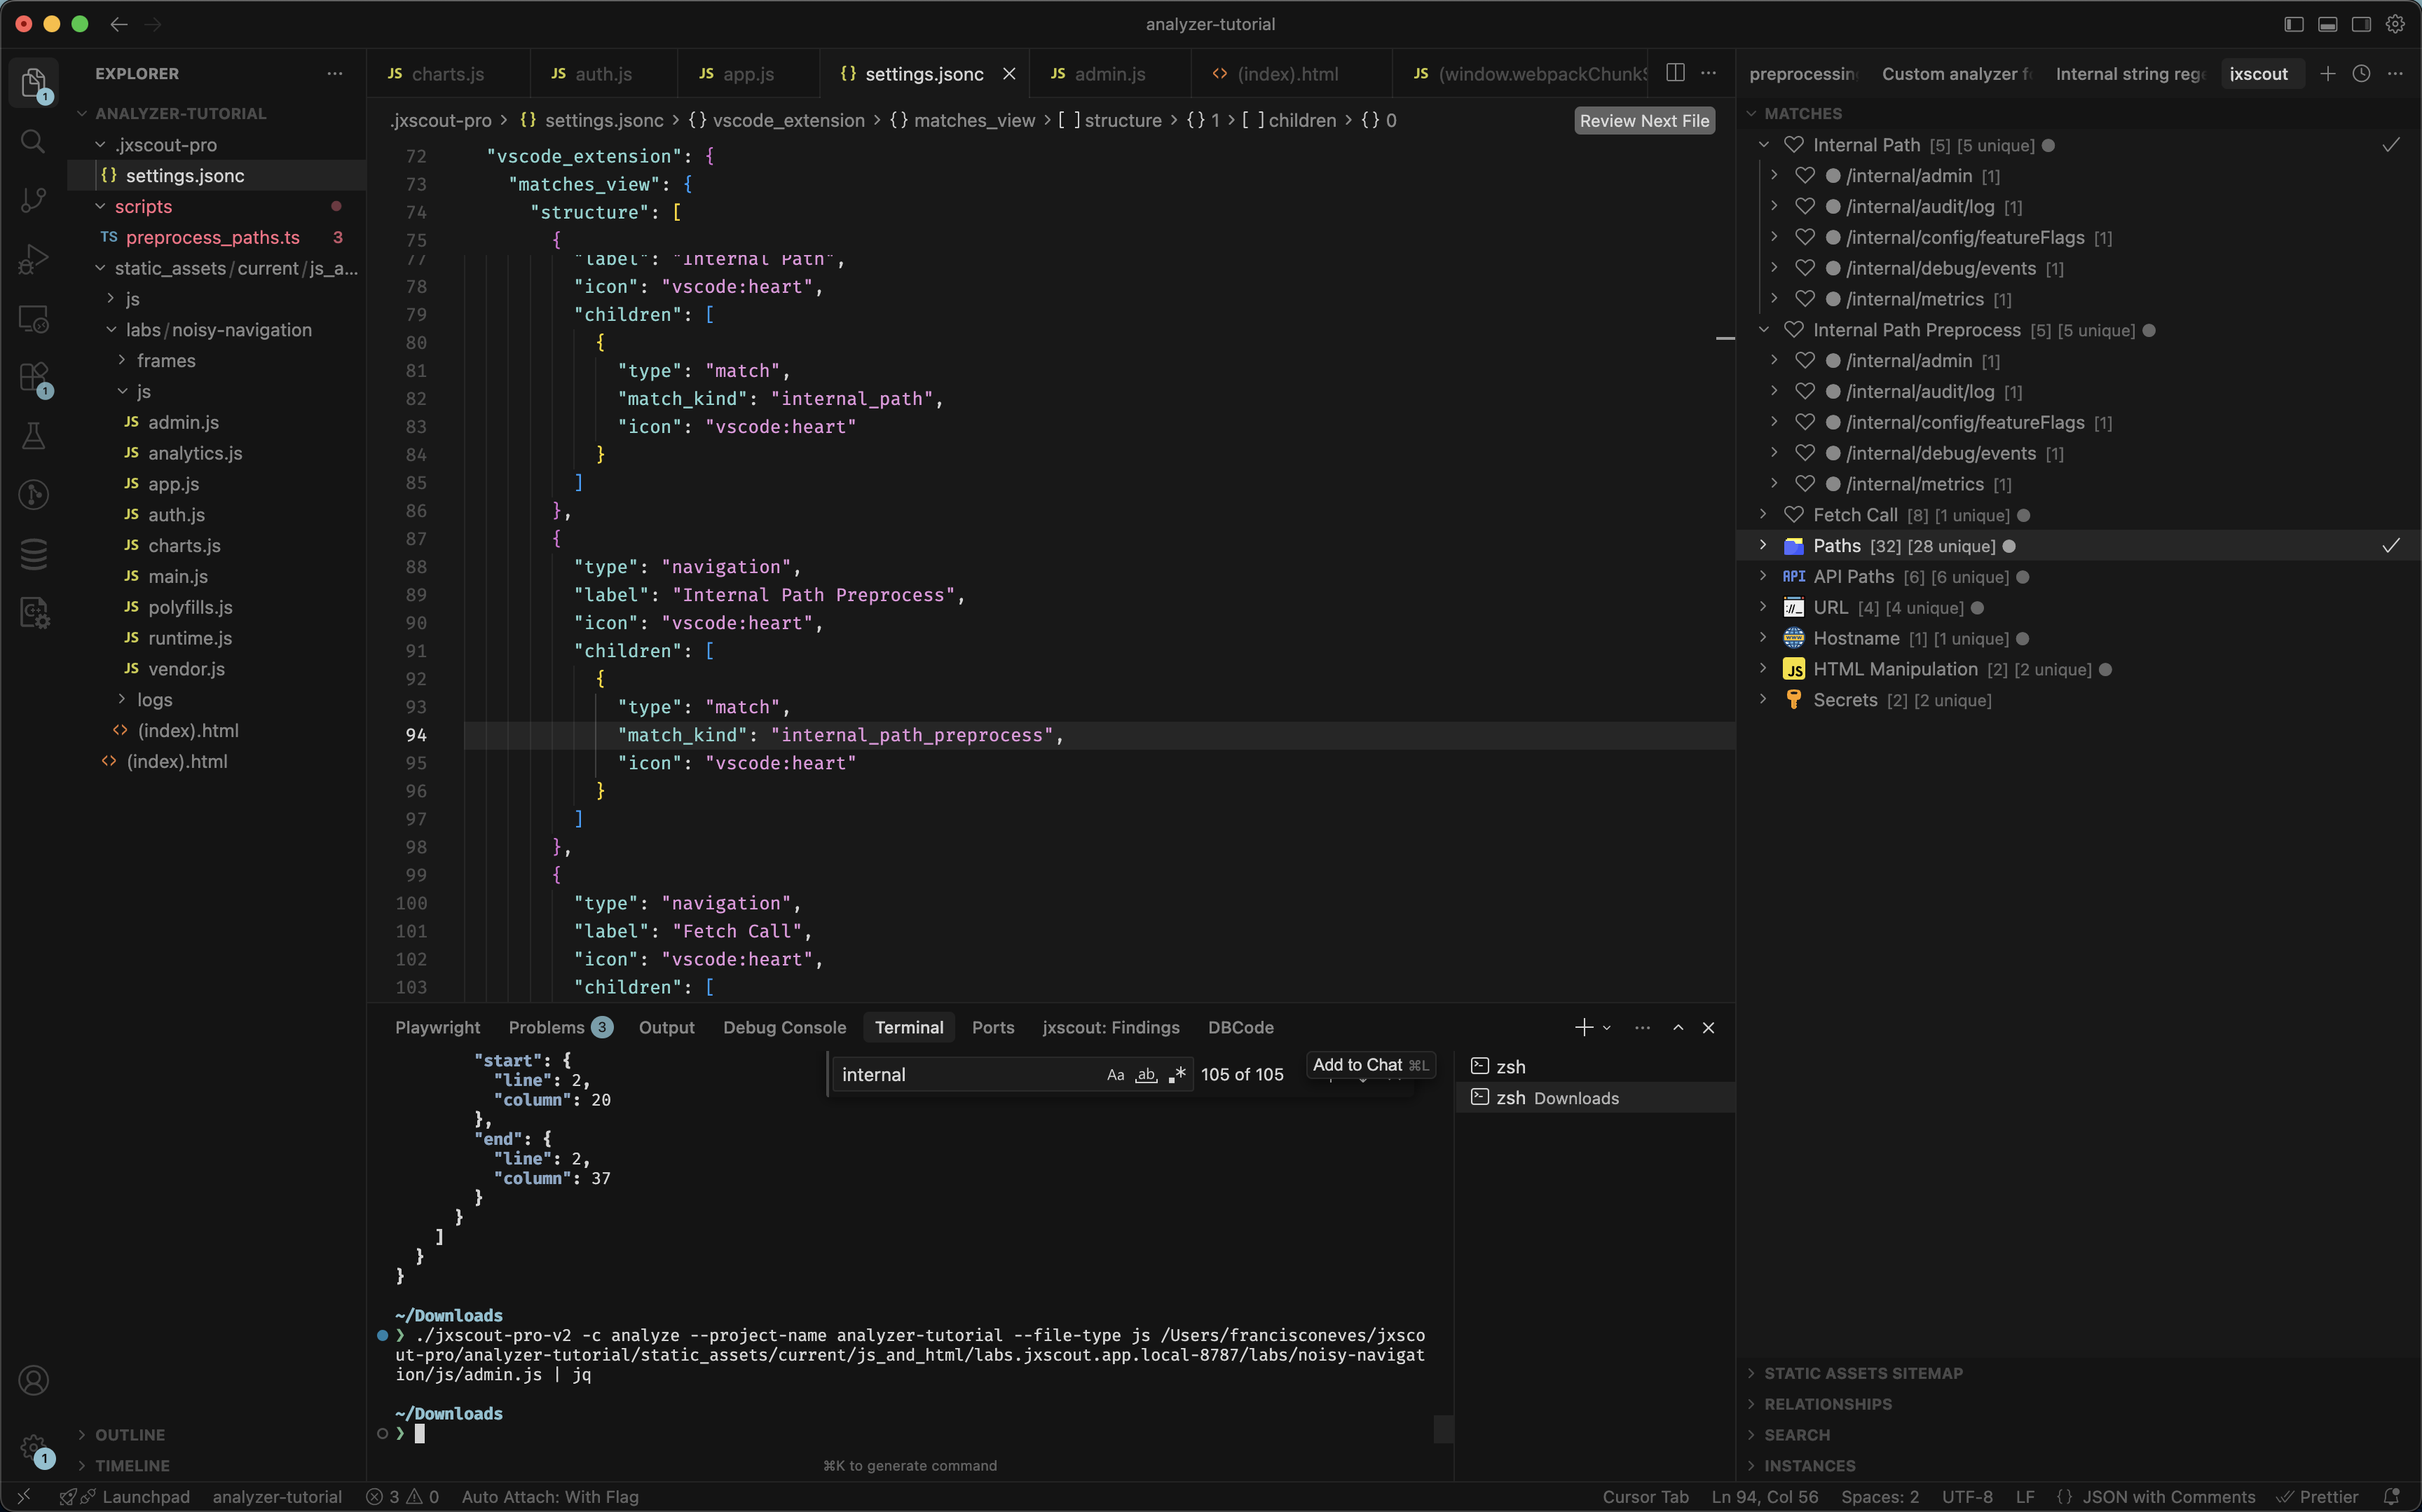
Finally, we will have a new section in our Matches view for internal paths:
Custom script analyzers
Let's now explore the last kind of custom analyzers that jxscout supports: custom script analyzers. These would be the most "complex" for you to implement, but they are also the ones that give you the most flexibility.
As an example, we will explore how we can use semgrep to help us quickly find patterns in our code. semgrep is a very powerful tool that allows you to quickly create rules using yaml files to match specific patterns, and underneath semgrep will use robust AST parsing to identify those code patterns.
Go ahead and install semgrep if you don't have it already.
As an example, let's implement the same fetch call example that we did for the regex analyzer, but now using the robust AST capabilities of semgrep.
LLMs are pretty good at creating semgrep rules!
Create a new file at semgrep/fetch_call.yaml inside your project folder and add the following:
rules:
  - id: detect-fetch-call
    message: Detected fetch() call
    pattern: fetch(...)
    languages:
      - javascript
      - typescript
    severity: INFO
You can test your rule using semgrep CLI:
$ semgrep scan --config semgrep/fetch_call.yaml ~/jxscout-pro/analyzer-tutorial/static_assets/current/js_and_html/labs.jxscout.app/labs/noisy-navigation/js/admin.js
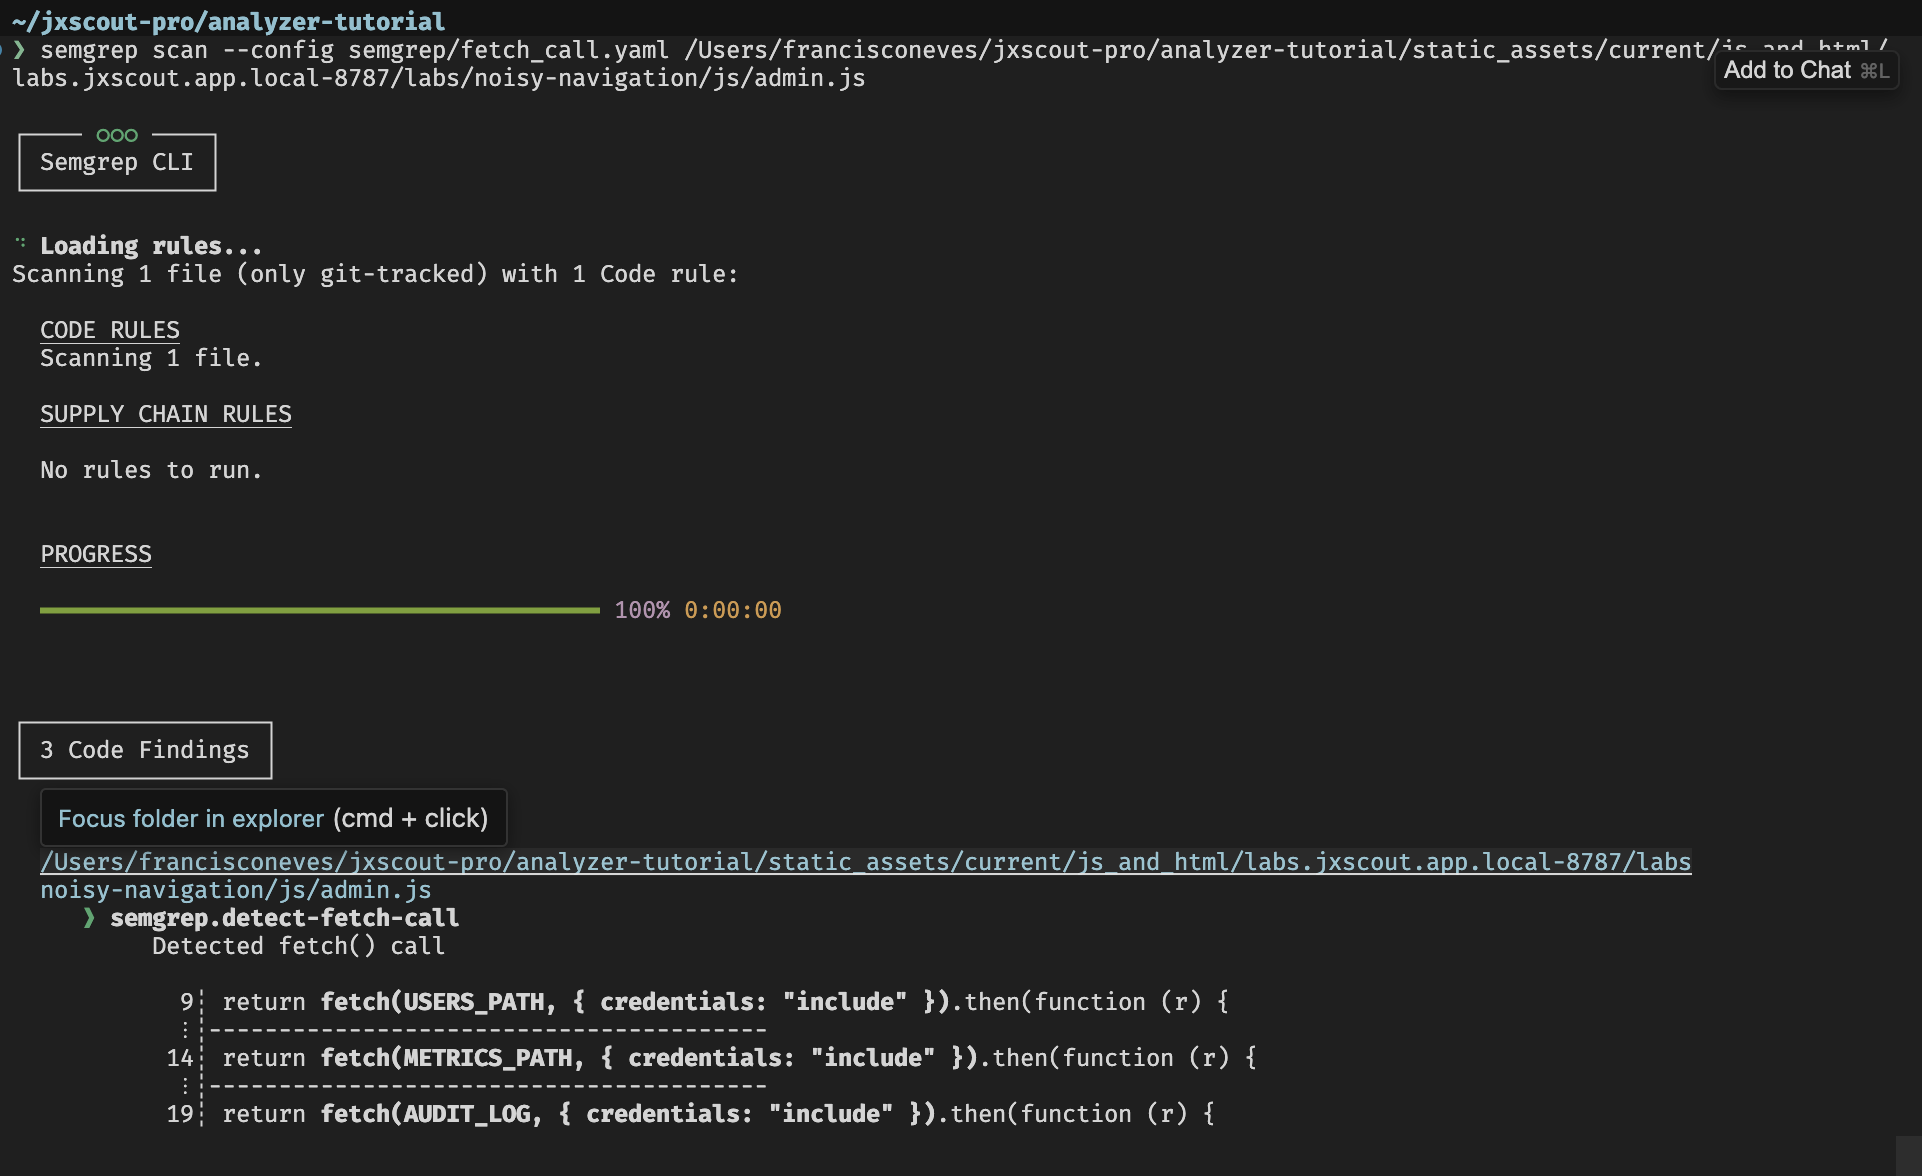
It seems like it's working. Let's see how we can now integrate this with jxscout. First we will use the --json flag in semgrep so we can easily extract the resulting matches in our script. Then we will need our script to output matches in a format recognizable by jxscout:
[
  {
    // the match kind
    "kind": "path",
    // the value that will be displayed in the VSCode extension
    "value": "/api/users",
    // the 0-based position in the source code
    "start": { "line": 1, "column": 1 },
    "end": { "line": 1, "column": 10 }
  }
  // ...
]
We can build a small script to convert semgrep output to jxscout format. Let's create scripts/semgrep_to_jxscout.sh inside our project folder.
#!/usr/bin/env bash
set -euo pipefail

RULE_PATH=""
KIND=""

while [[ $# -gt 0 ]]; do
  case $1 in
    -r|--rule) RULE_PATH="$2"; shift 2 ;;
    -k|--kind) KIND="$2"; shift 2 ;;
    *) echo "Usage: $0 -r|--rule <rule_path> -k|--kind <kind> (file paths on stdin)" >&2; exit 1 ;;
  esac
done

[[ -n "$RULE_PATH" ]] || { echo "Missing -r|--rule <path>" >&2; exit 1; }
[[ -n "$KIND" ]] || { echo "Missing -k|--kind <kind>" >&2; exit 1; }

FILES=()
while IFS= read -r line || [[ -n "$line" ]]; do
  [[ -n "$line" ]] && FILES+=("$line")
done

[[ ${#FILES[@]} -gt 0 ]] || { echo "No file paths on stdin" >&2; exit 1; }

SEMGREP_JSON=$(semgrep scan --config "$RULE_PATH" "${FILES[@]}" --json --quiet)

output=""
while IFS= read -r result; do
  path=$(echo "$result" | jq -r '.path')
  start_offset=$(echo "$result" | jq -r '.start.offset')
  end_offset=$(echo "$result" | jq -r '.end.offset')
  start_line=$(echo "$result" | jq -r '.start.line')
  start_col=$(echo "$result" | jq -r '.start.col')
  end_line=$(echo "$result" | jq -r '.end.line')
  end_col=$(echo "$result" | jq -r '.end.col')

  value=$(tail -c +$((start_offset + 1)) "$path" | head -c $((end_offset - start_offset)))

  one=$(jq -cn \
    --arg kind "$KIND" \
    --arg value "$value" \
    --argjson start_line "$start_line" \
    --argjson start_col "$start_col" \
    --argjson end_line "$end_line" \
    --argjson end_col "$end_col" \
    '{kind: $kind, value: $value, start: {line: $start_line, column: $start_col}, end: {line: $end_line, column: $end_col}}')
  output="${output}${one}"$'\n'
done < <(echo "$SEMGREP_JSON" | jq -c '.results[]? // empty')

if [[ -z "$output" ]]; then
  echo "[]"
else
  echo "$output" | jq -cs 'if . == null then [] else . end'
fi
jxscout passes the file path to be analyzed on stdin, so jxscout will run this script as follows:
$ echo ~/jxscout-pro/analyzer-tutorial/static_assets/current/js_and_html/labs.jxscout.app/labs/noisy-navigation/js/admin.js | ./scripts/semgrep_to_jxscout.sh --rule semgrep/fetch_call.yaml --kind fetch_call_script
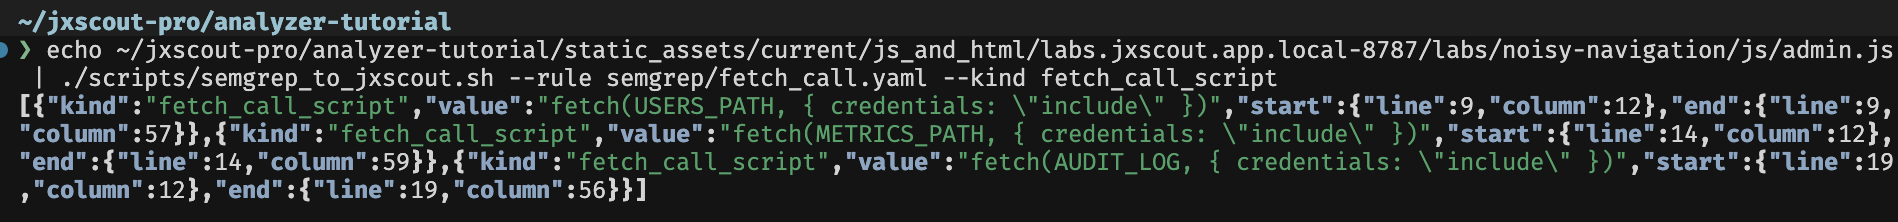
Great! Now that we have a working script we just need to add this custom analyzer to jxscout, update the Matches view configuration, and retrigger the analysis.
{
  // ...
  "analyzer": {
    // ...
    "custom_analyzers": {
      // ...
      "fetch_calls_script": {
        "enabled": true,
        "type": "script",
        "file_types": ["js", "reversed_source"],
        "script": "$JXSCOUT_PROJECT_DIR/scripts/semgrep_to_jxscout.sh --rule $JXSCOUT_PROJECT_DIR/semgrep/fetch_call.yaml --kind fetch_call_script"
      }
    }
  },
  "vscode_extension": {
    "matches_view": {
      "structure": [
        {
          "type": "navigation",
          "label": "Fetch Call Script",
          "icon": "vscode:heart",
          "children": [
            {
              "type": "match",
              "match_kind": "fetch_call_script",
              "icon": "vscode:heart"
            }
          ]
        }
      ]
    }
  }
}
Since extend_default_structure defaults to true, only the custom entry is needed — it gets merged with the built-in structure automatically.
Let's do a quick check that our script is working with the following command:
$ jxscout-pro-v2 -c analyze --project-name analyzer-tutorial --file-type js ~/jxscout-pro/analyzer-tutorial/static_assets/current/js_and_html/labs.jxscout.app/labs/noisy-navigation/js/admin.js
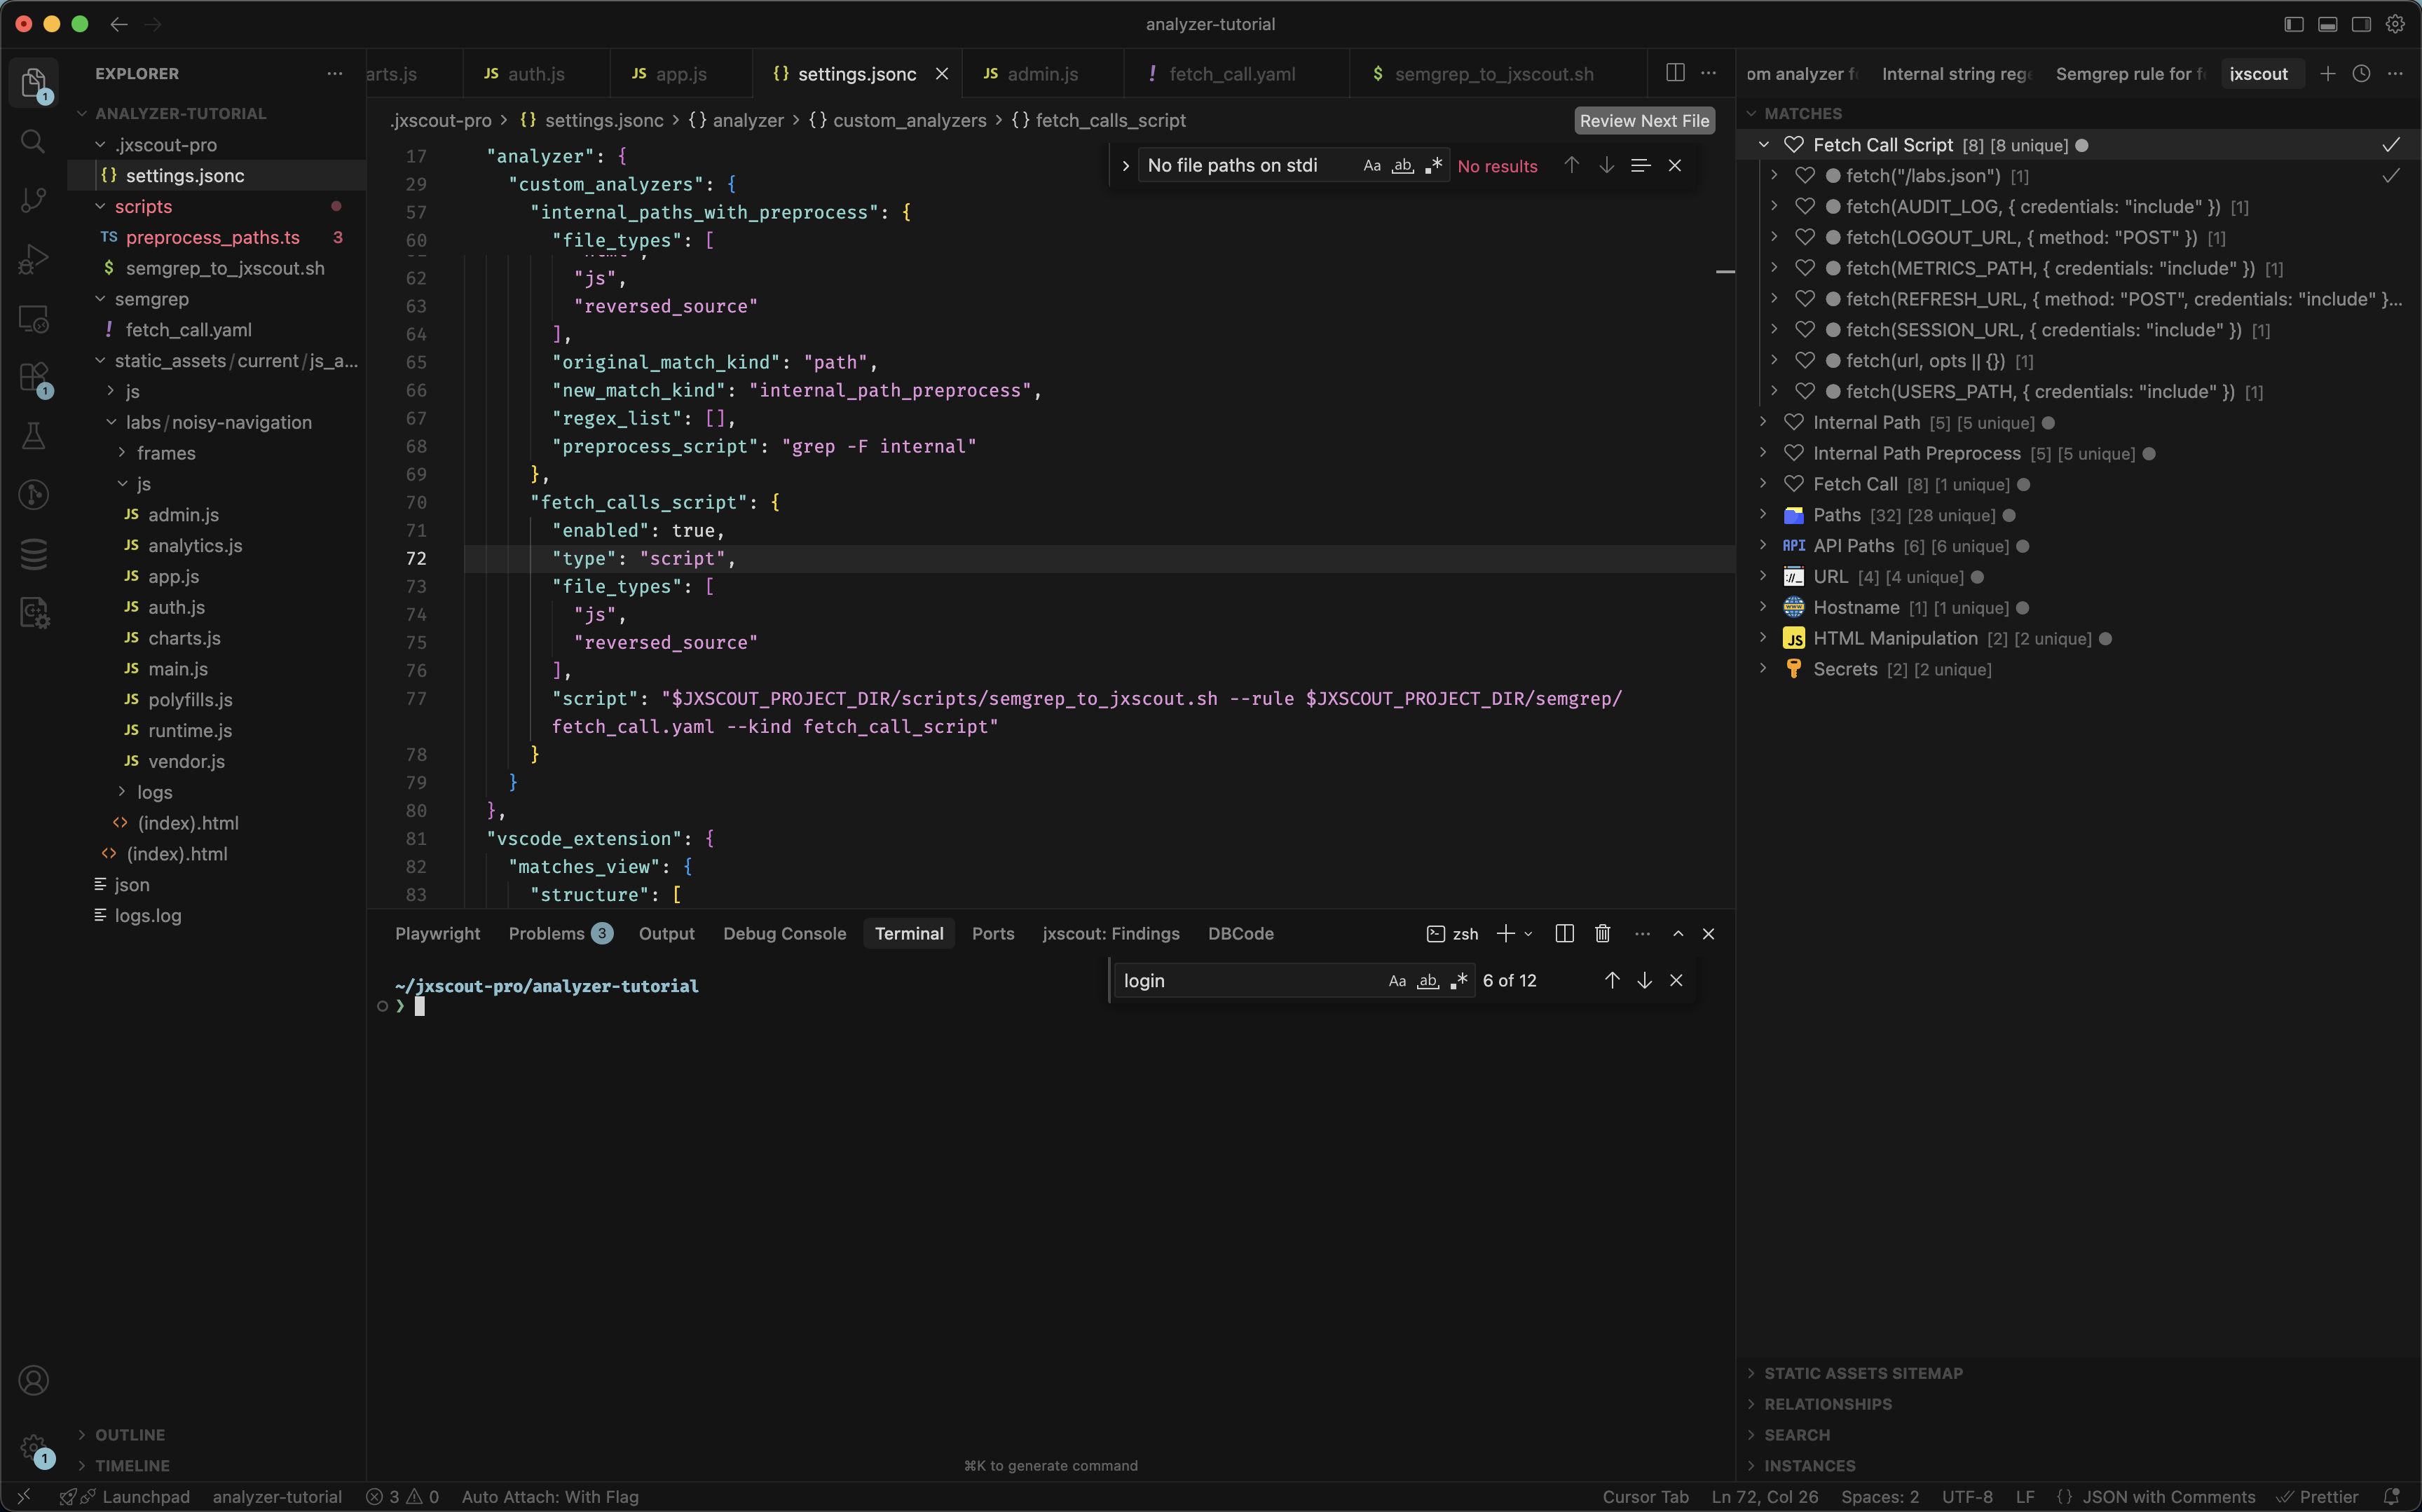
And after retriggering the analysis on your project, you should end up with the following view:
Conclusion
In this guide we did a deep dive into the analyzer module and how you can extend it to add your own custom match kinds, shaping jxscout to your personal workflow.
If you find yourself grepping around the code base looking for specific patterns, or perhaps filtering in/out matches too much, maybe a combination of preprocess scripts and custom analyzers could make your workflow even more efficient.