Getting started
This guide will walk you through getting the jxscout CLI, the jxscout VSCode extension, and the jxscout Chrome extension installed.
Installing the CLI
If you subscribed to jxscout pro or received a free trial, you should have received a link to download the CLI.
The link will look like this: https://jxscout.app/v2/download?licenseKey=your_license_key.
The first step is to go to that link, select your platform, and download the jxscout CLI.
After downloading, you should extract the .tar file; inside you will find a jxscout-pro-v2 binary. Depending on your platform, you may need to grant it permission to run.
When you first run the CLI, you will be asked for a license key. This is the same key as the one in your download link. You will also be asked if you want to add jxscout-pro-v2 to your PATH. It's recommended that you do so you can run jxscout-pro-v2 from any directory.
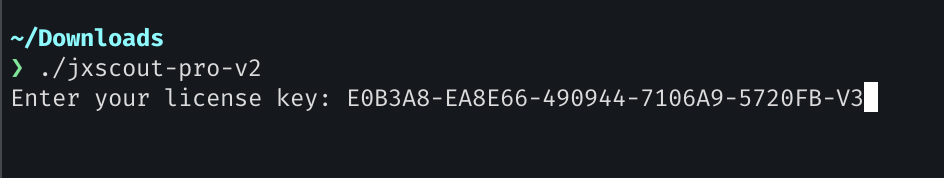
Some instructions will be shown when you start it, but it's better to use this documentation to get started with jxscout.
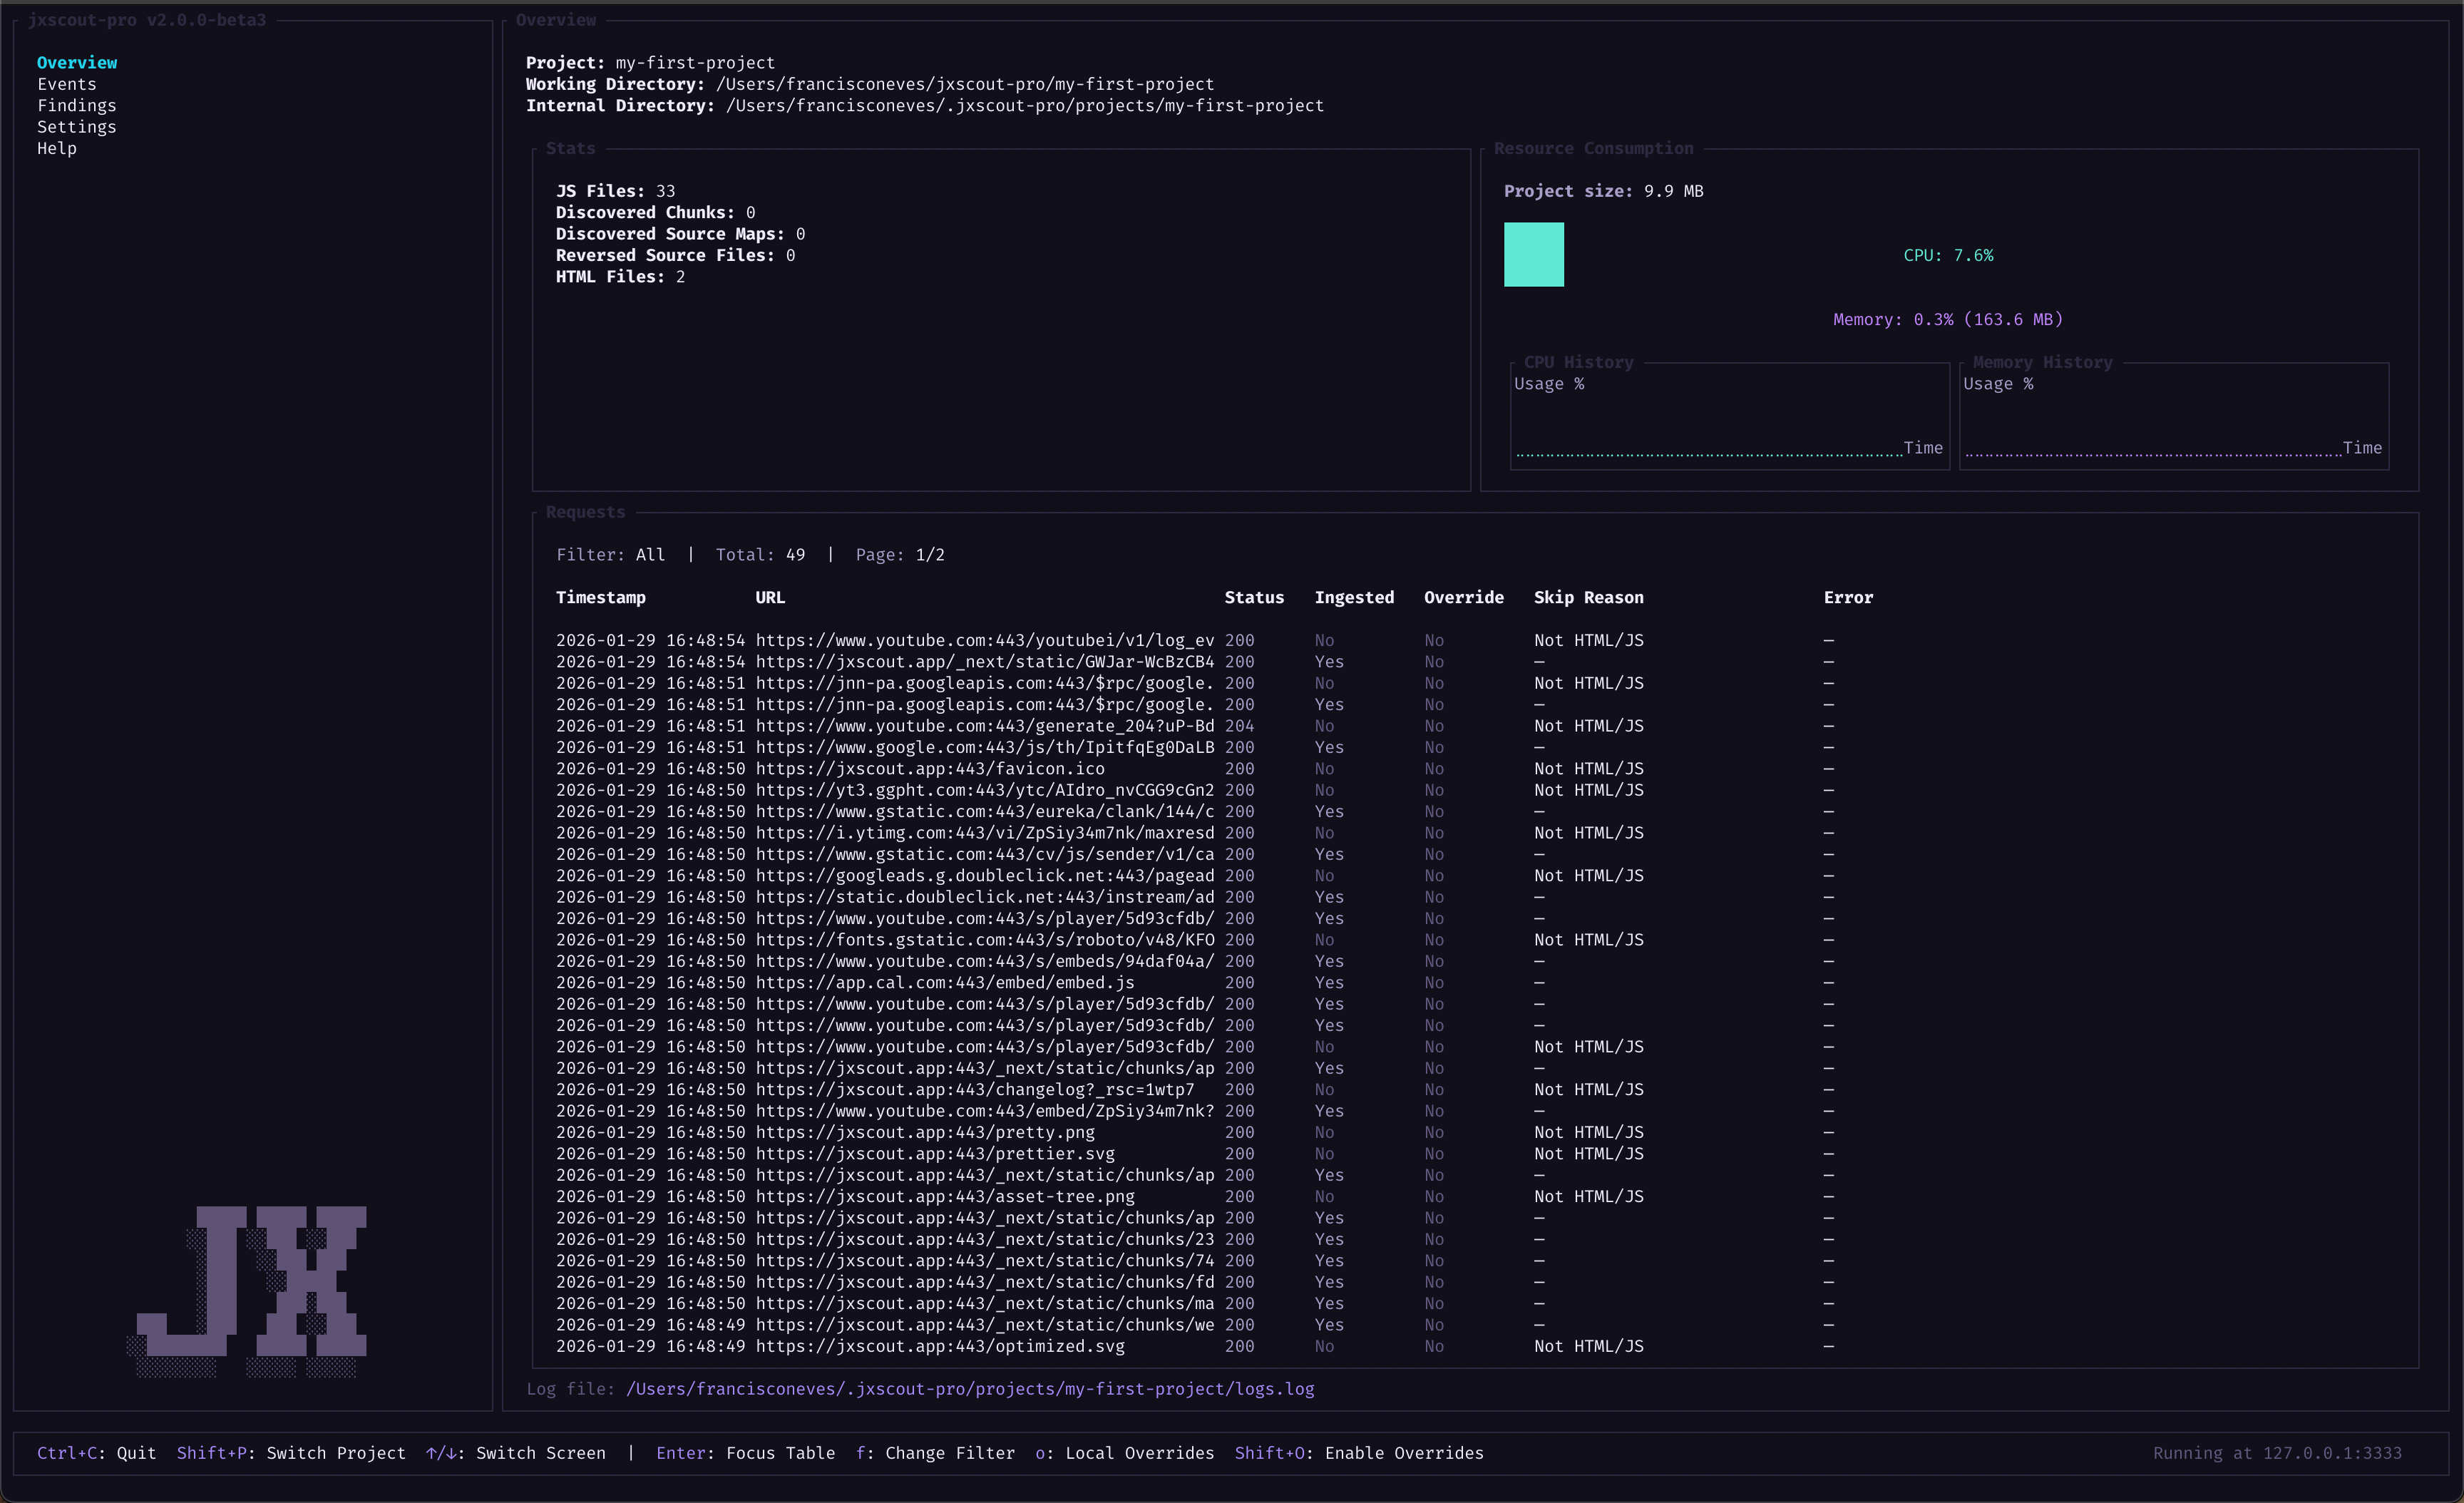
If all went well, you should land in the following screen, where you can create a new project! 🎉
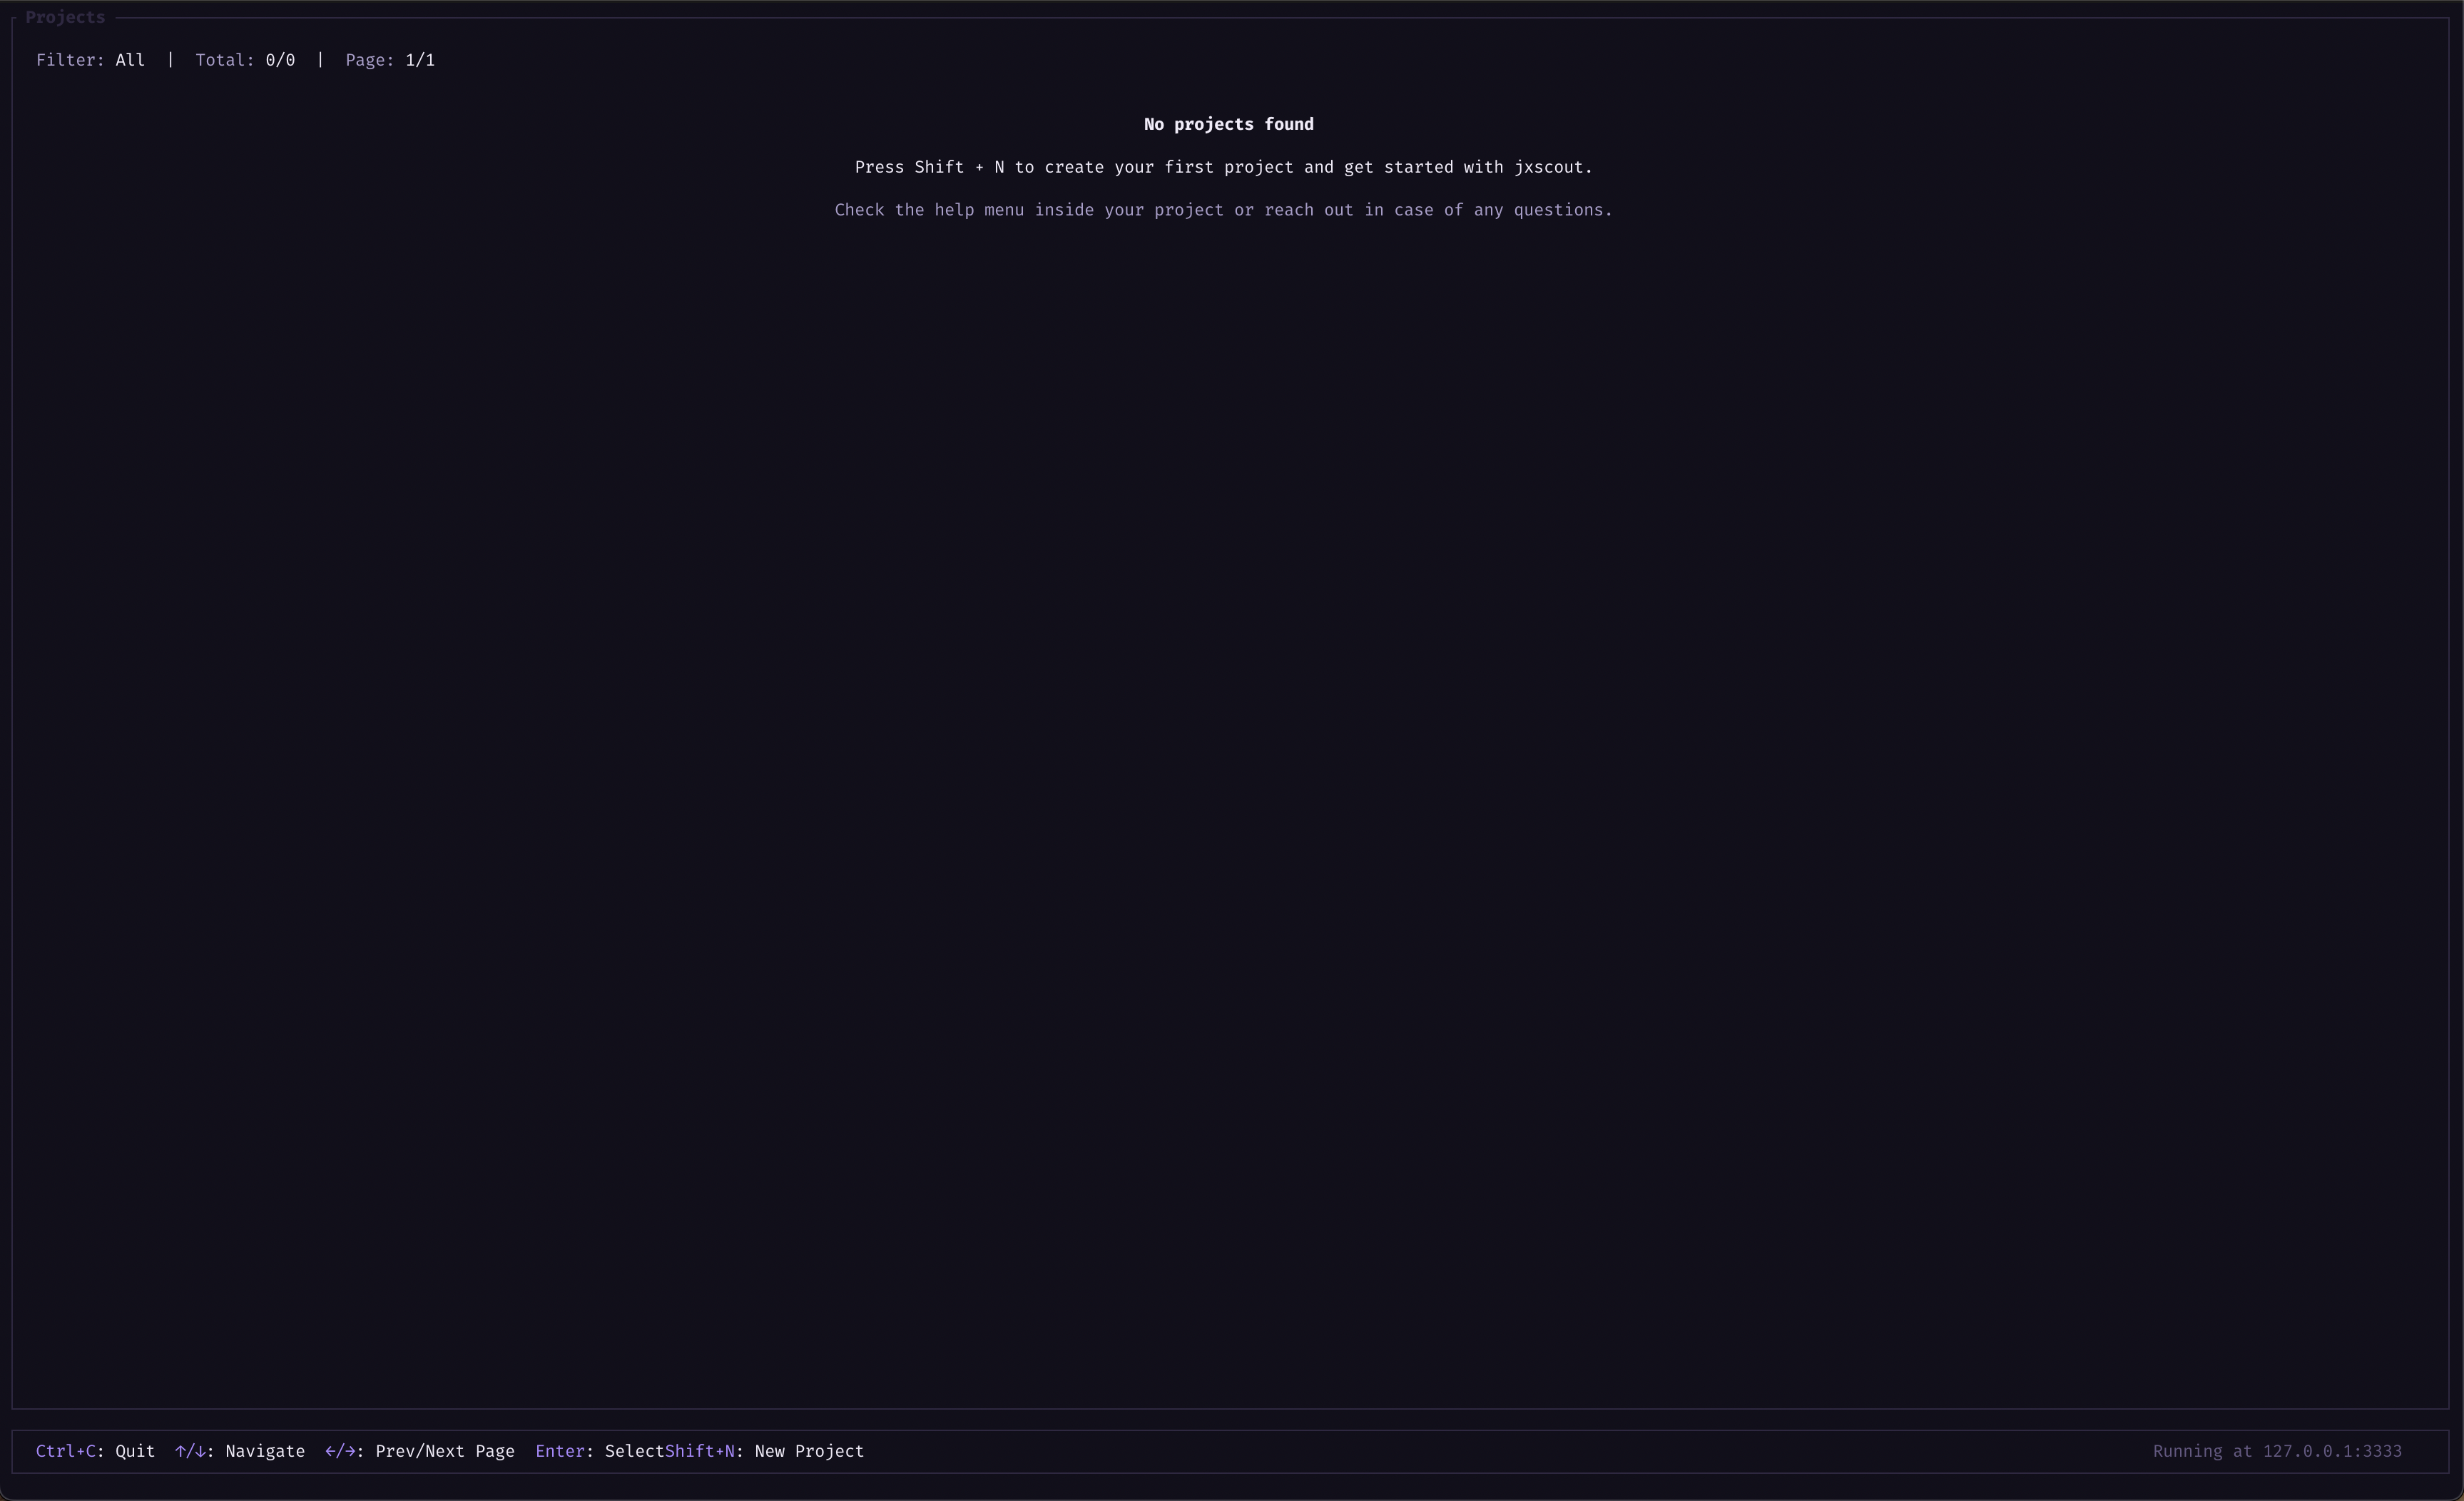
Creating our first project
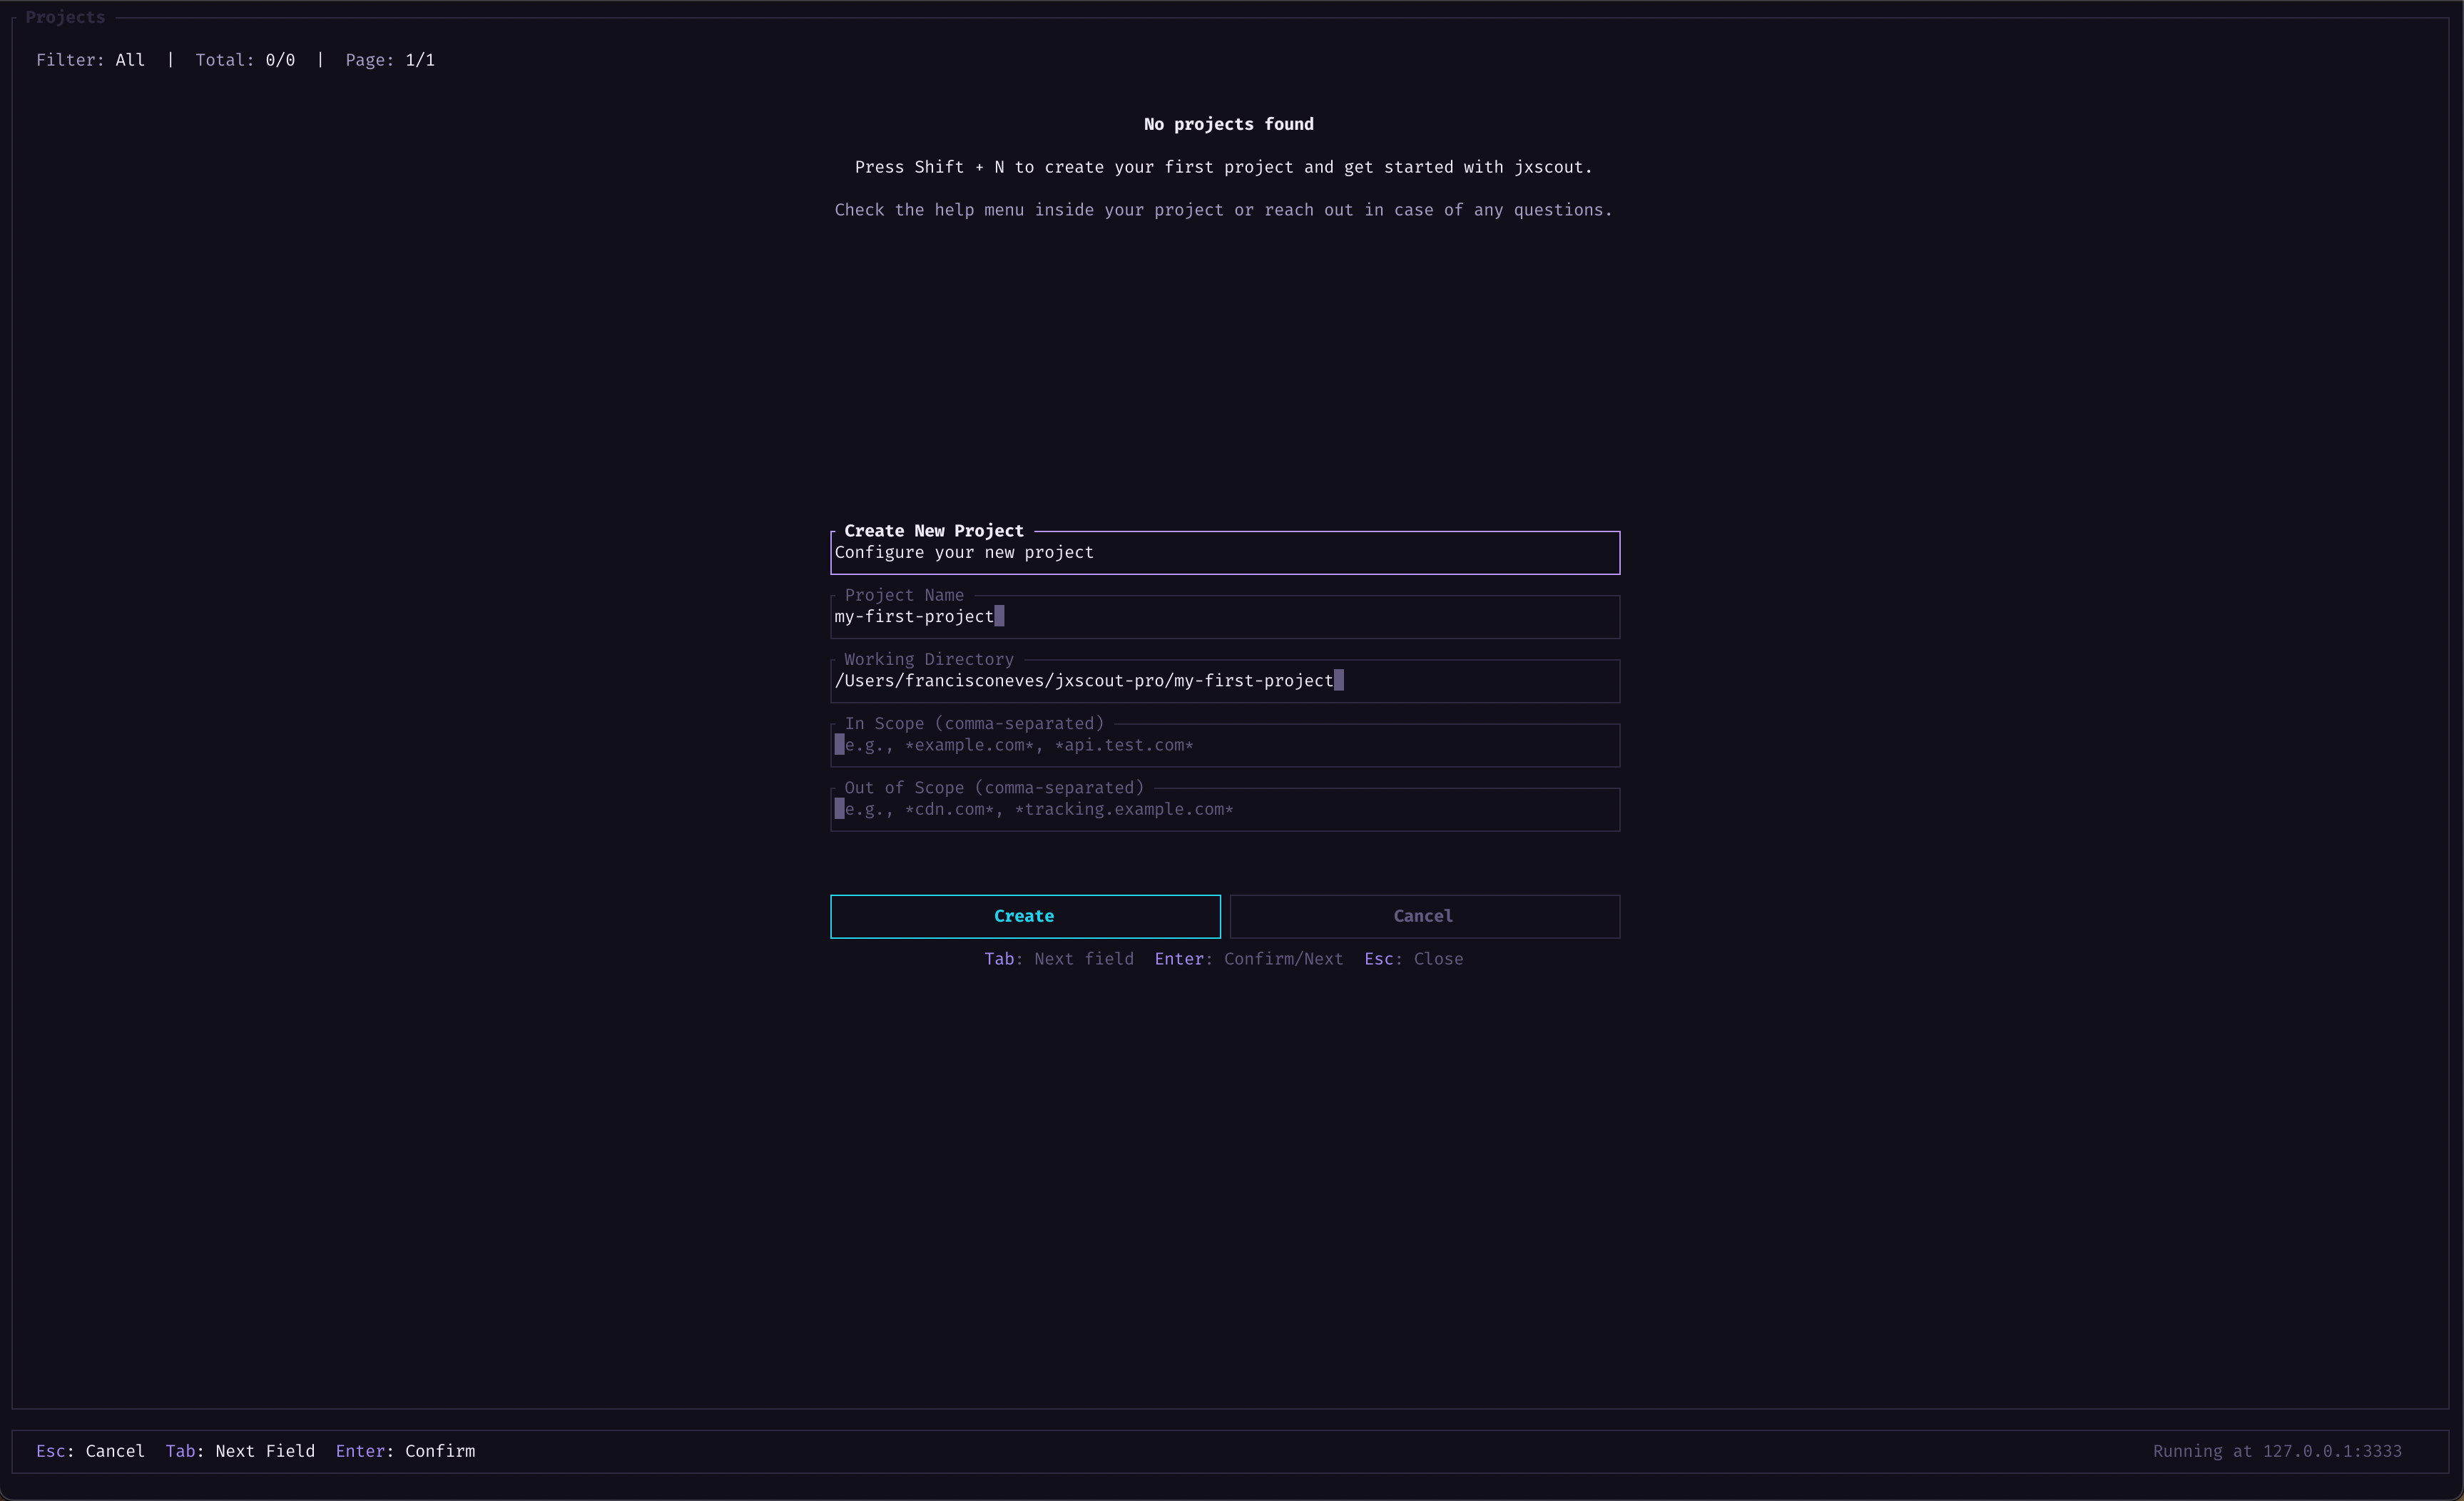
On the bottom bar, you will find some shortcuts. Let's press Shift+N to create a new project.
Enter a project name, and for now leave the other inputs empty or with their default values. Press Enter on Create to create your first project.
Configuring Burp and Caido
Now that we have the jxscout CLI up and running, we can configure our proxy to send requests to jxscout.
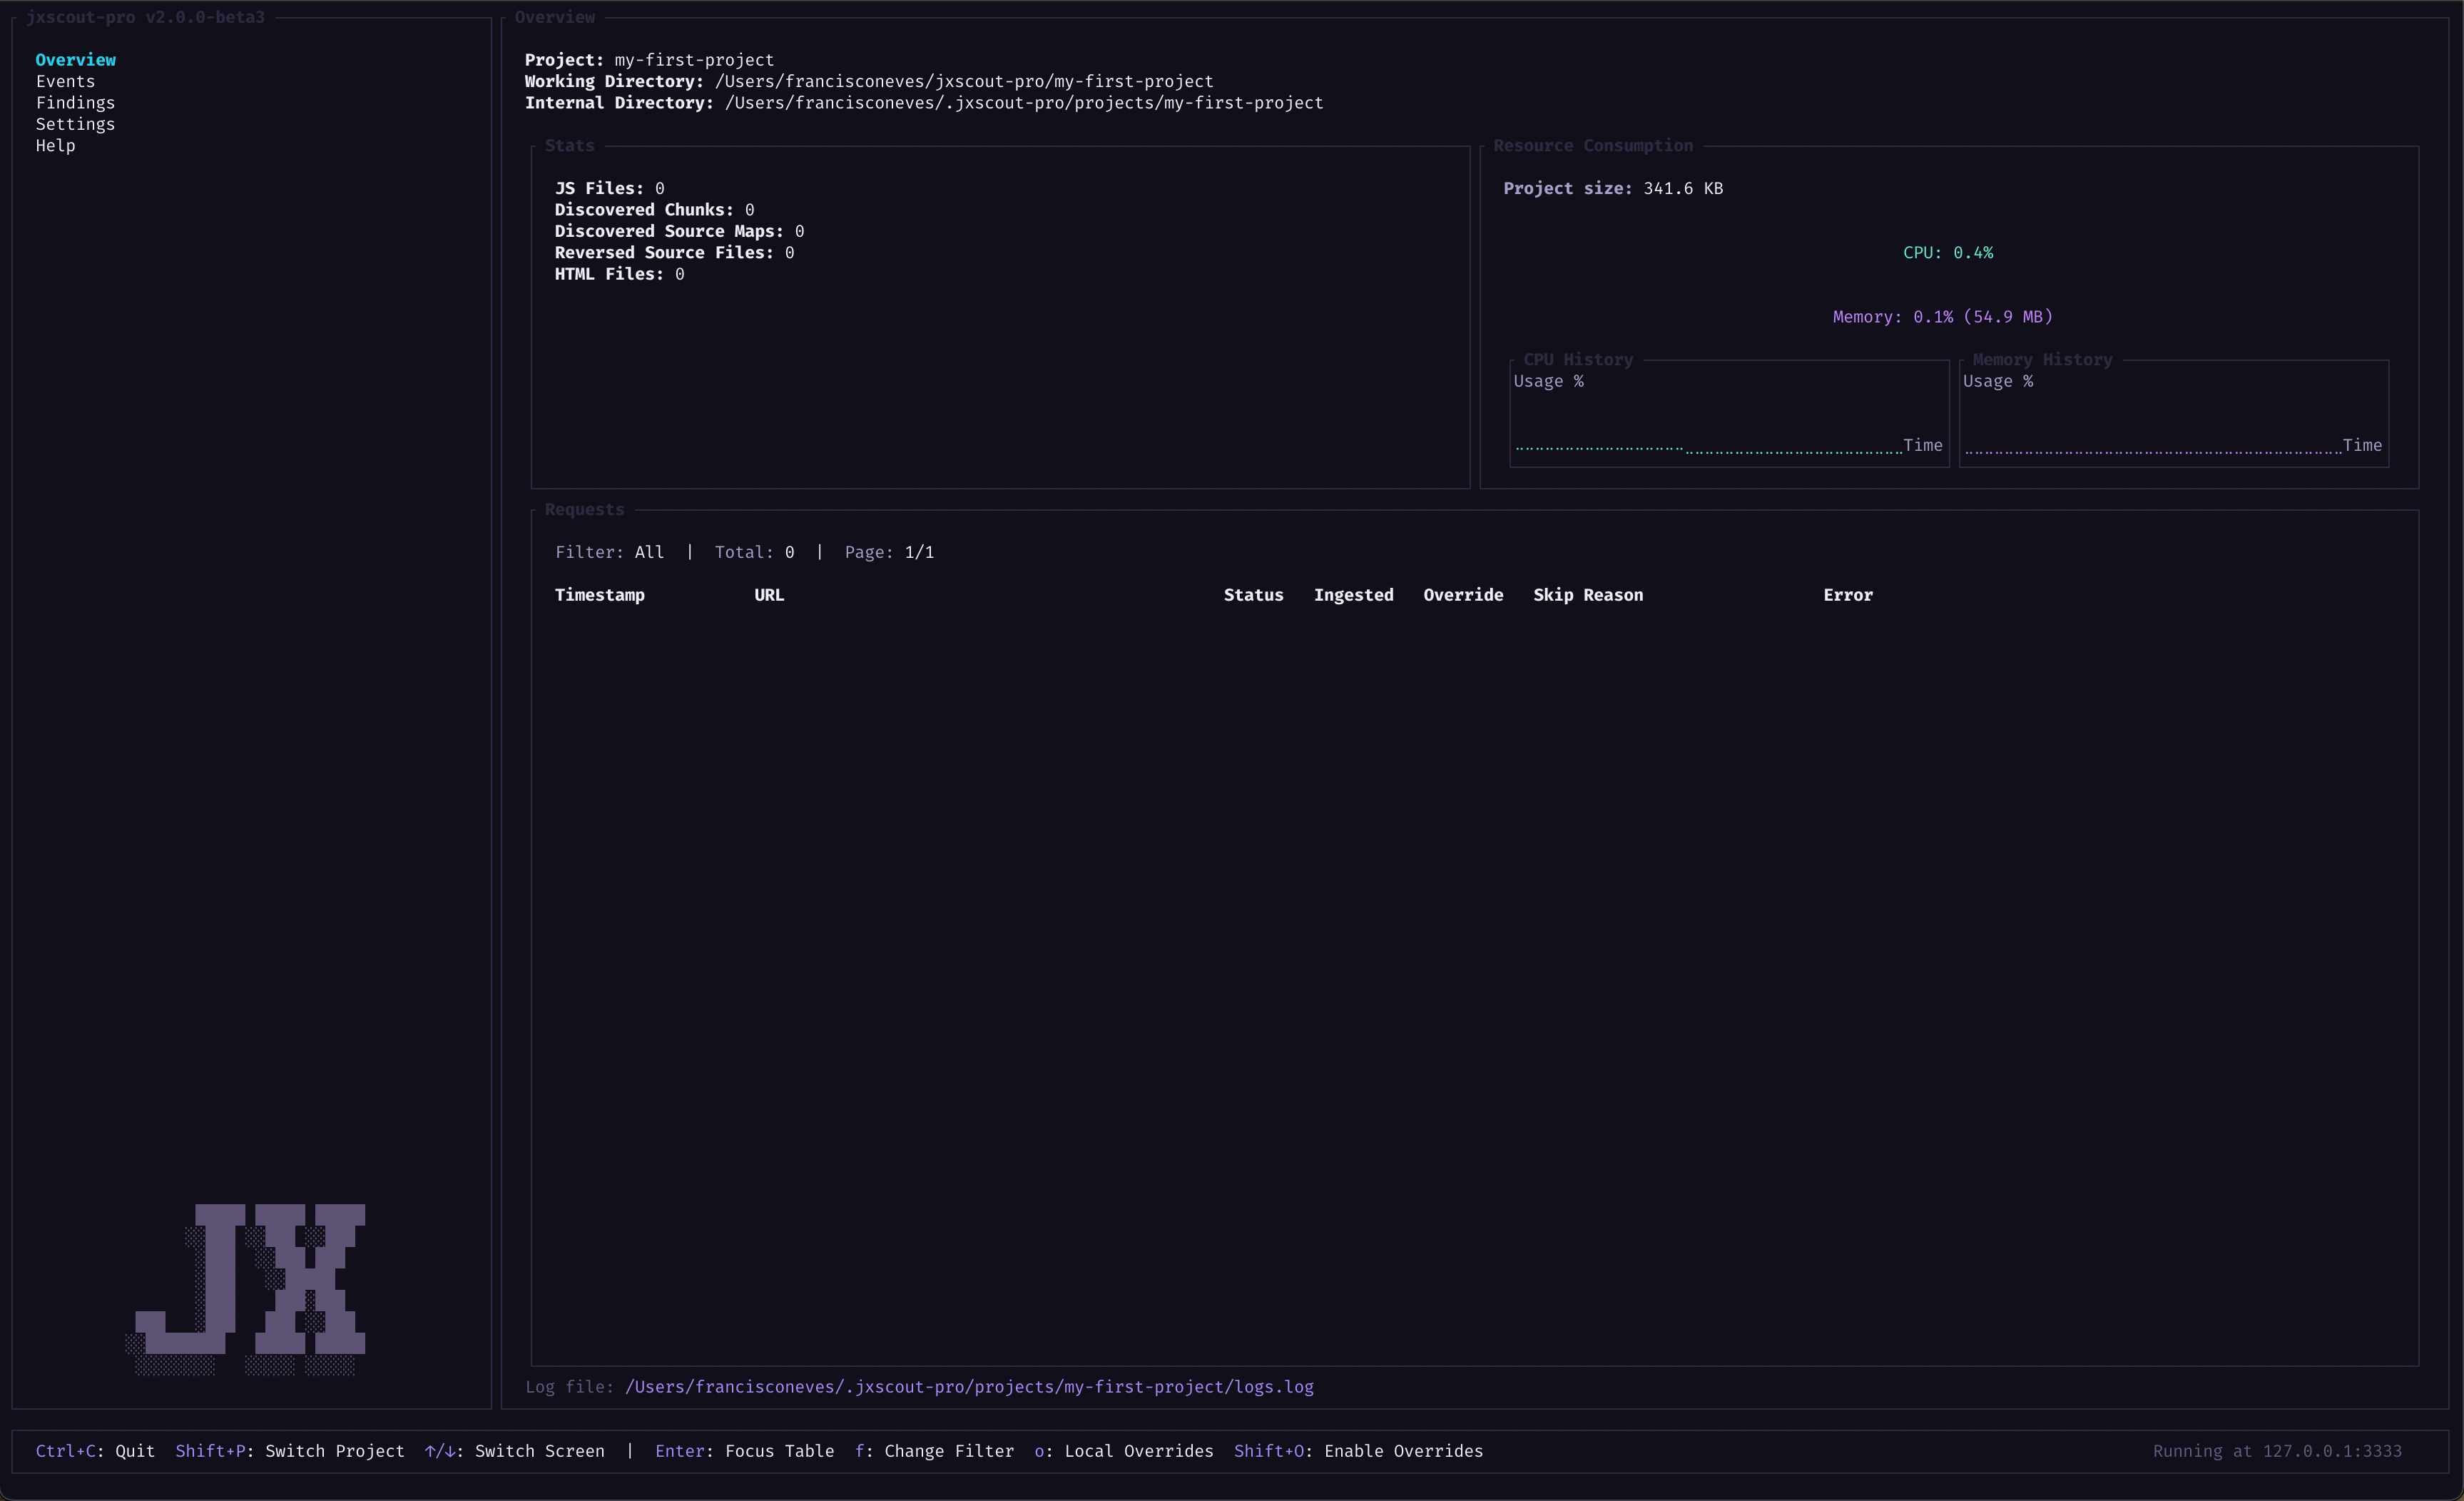
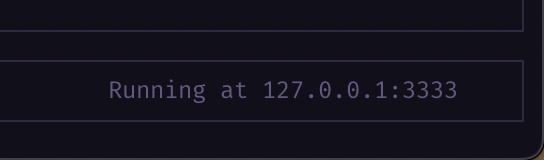
Before configuring the plugin, let's check which port jxscout is running on. By default, jxscout binds to port 3333, but if that port is already used by another process, jxscout will try to find another available port.
At the bottom right of jxscout CLI, you will find the port jxscout is running on.
Burp configuration
To install the jxscout plugin for Burp:
- Download the latest plugin from the jxscout-burp releases.
- In Burp, go to Settings > Extensions > Add.
- Select the downloaded plugin file and install it.
- In the plugin settings, make sure the host is set to
127.0.0.1and the port matches the jxscout port (default3333, check above). - Make sure your browser is proxying requests through Burp.
- Reload a page in your browser.
Caido configuration
To install the jxscout plugin for Caido:
- Download the latest plugin from the jxscout-caido releases.
- In Caido, go to the Plugins section and install the downloaded plugin.
- In the plugin settings, make sure the host is set to
127.0.0.1and the port matches the jxscout port (default3333, check above). - Make sure your browser is proxying requests through Caido.
- Reload a page in your browser.
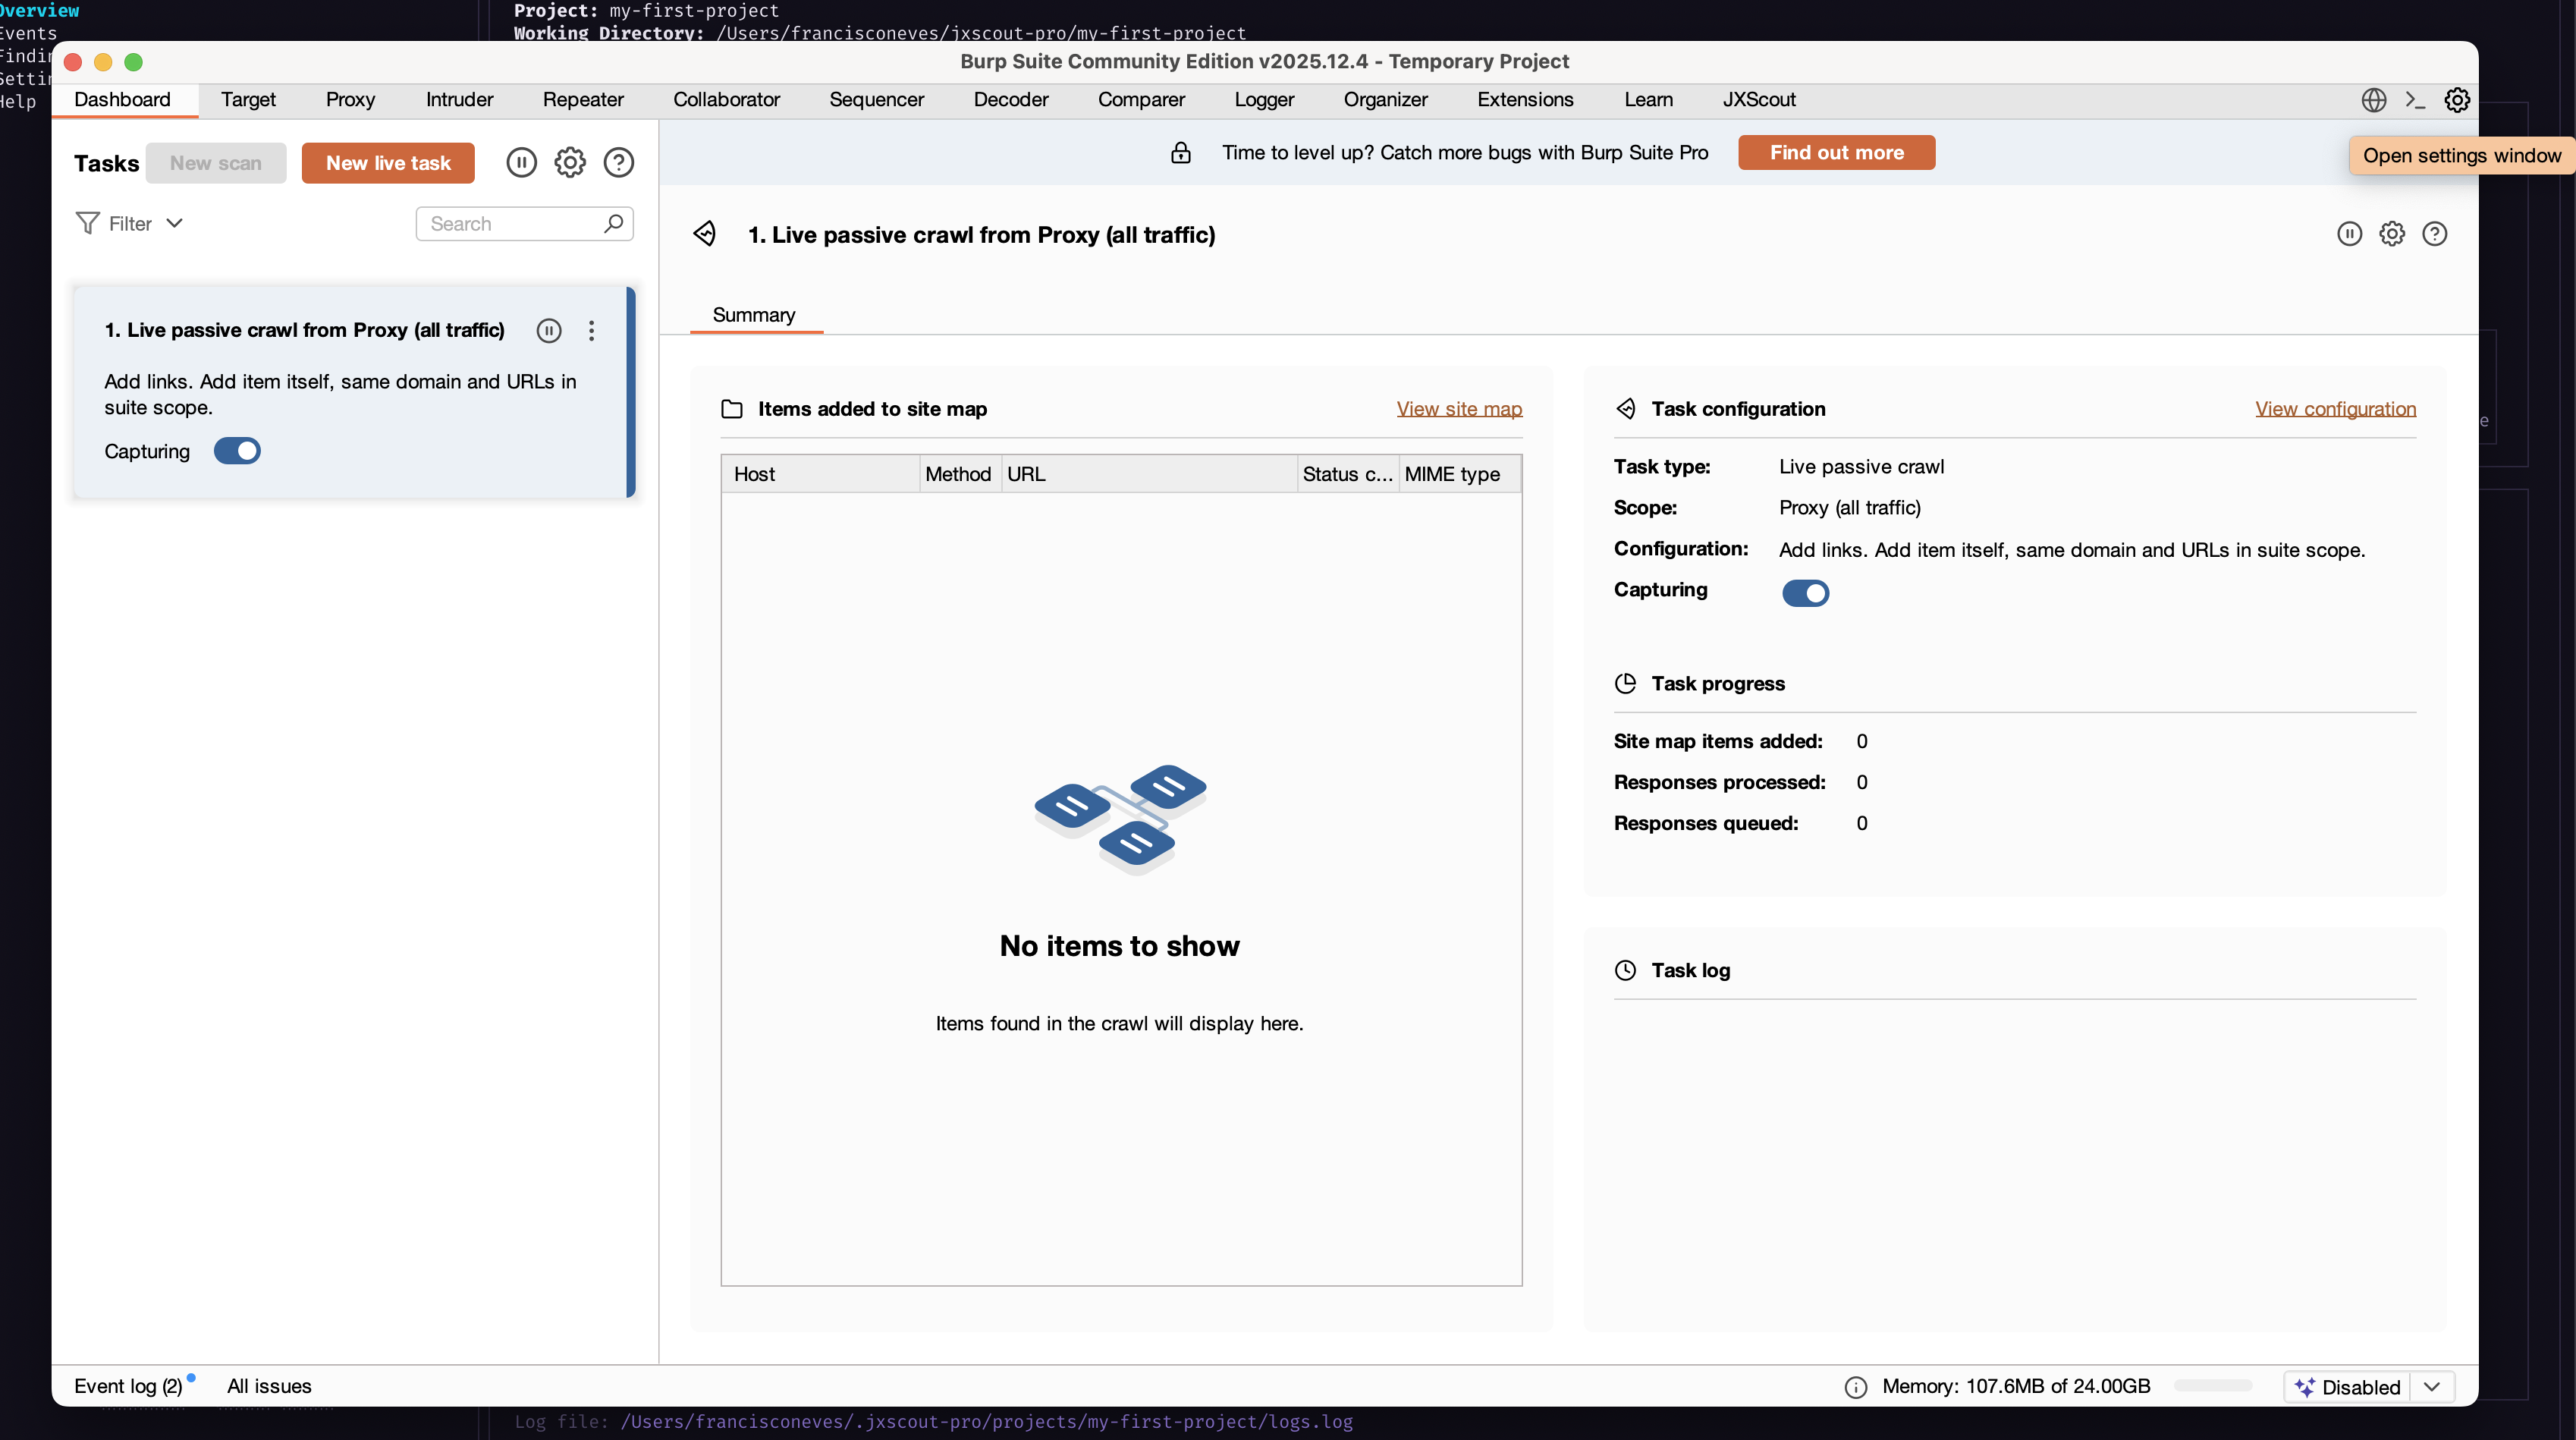
Verification
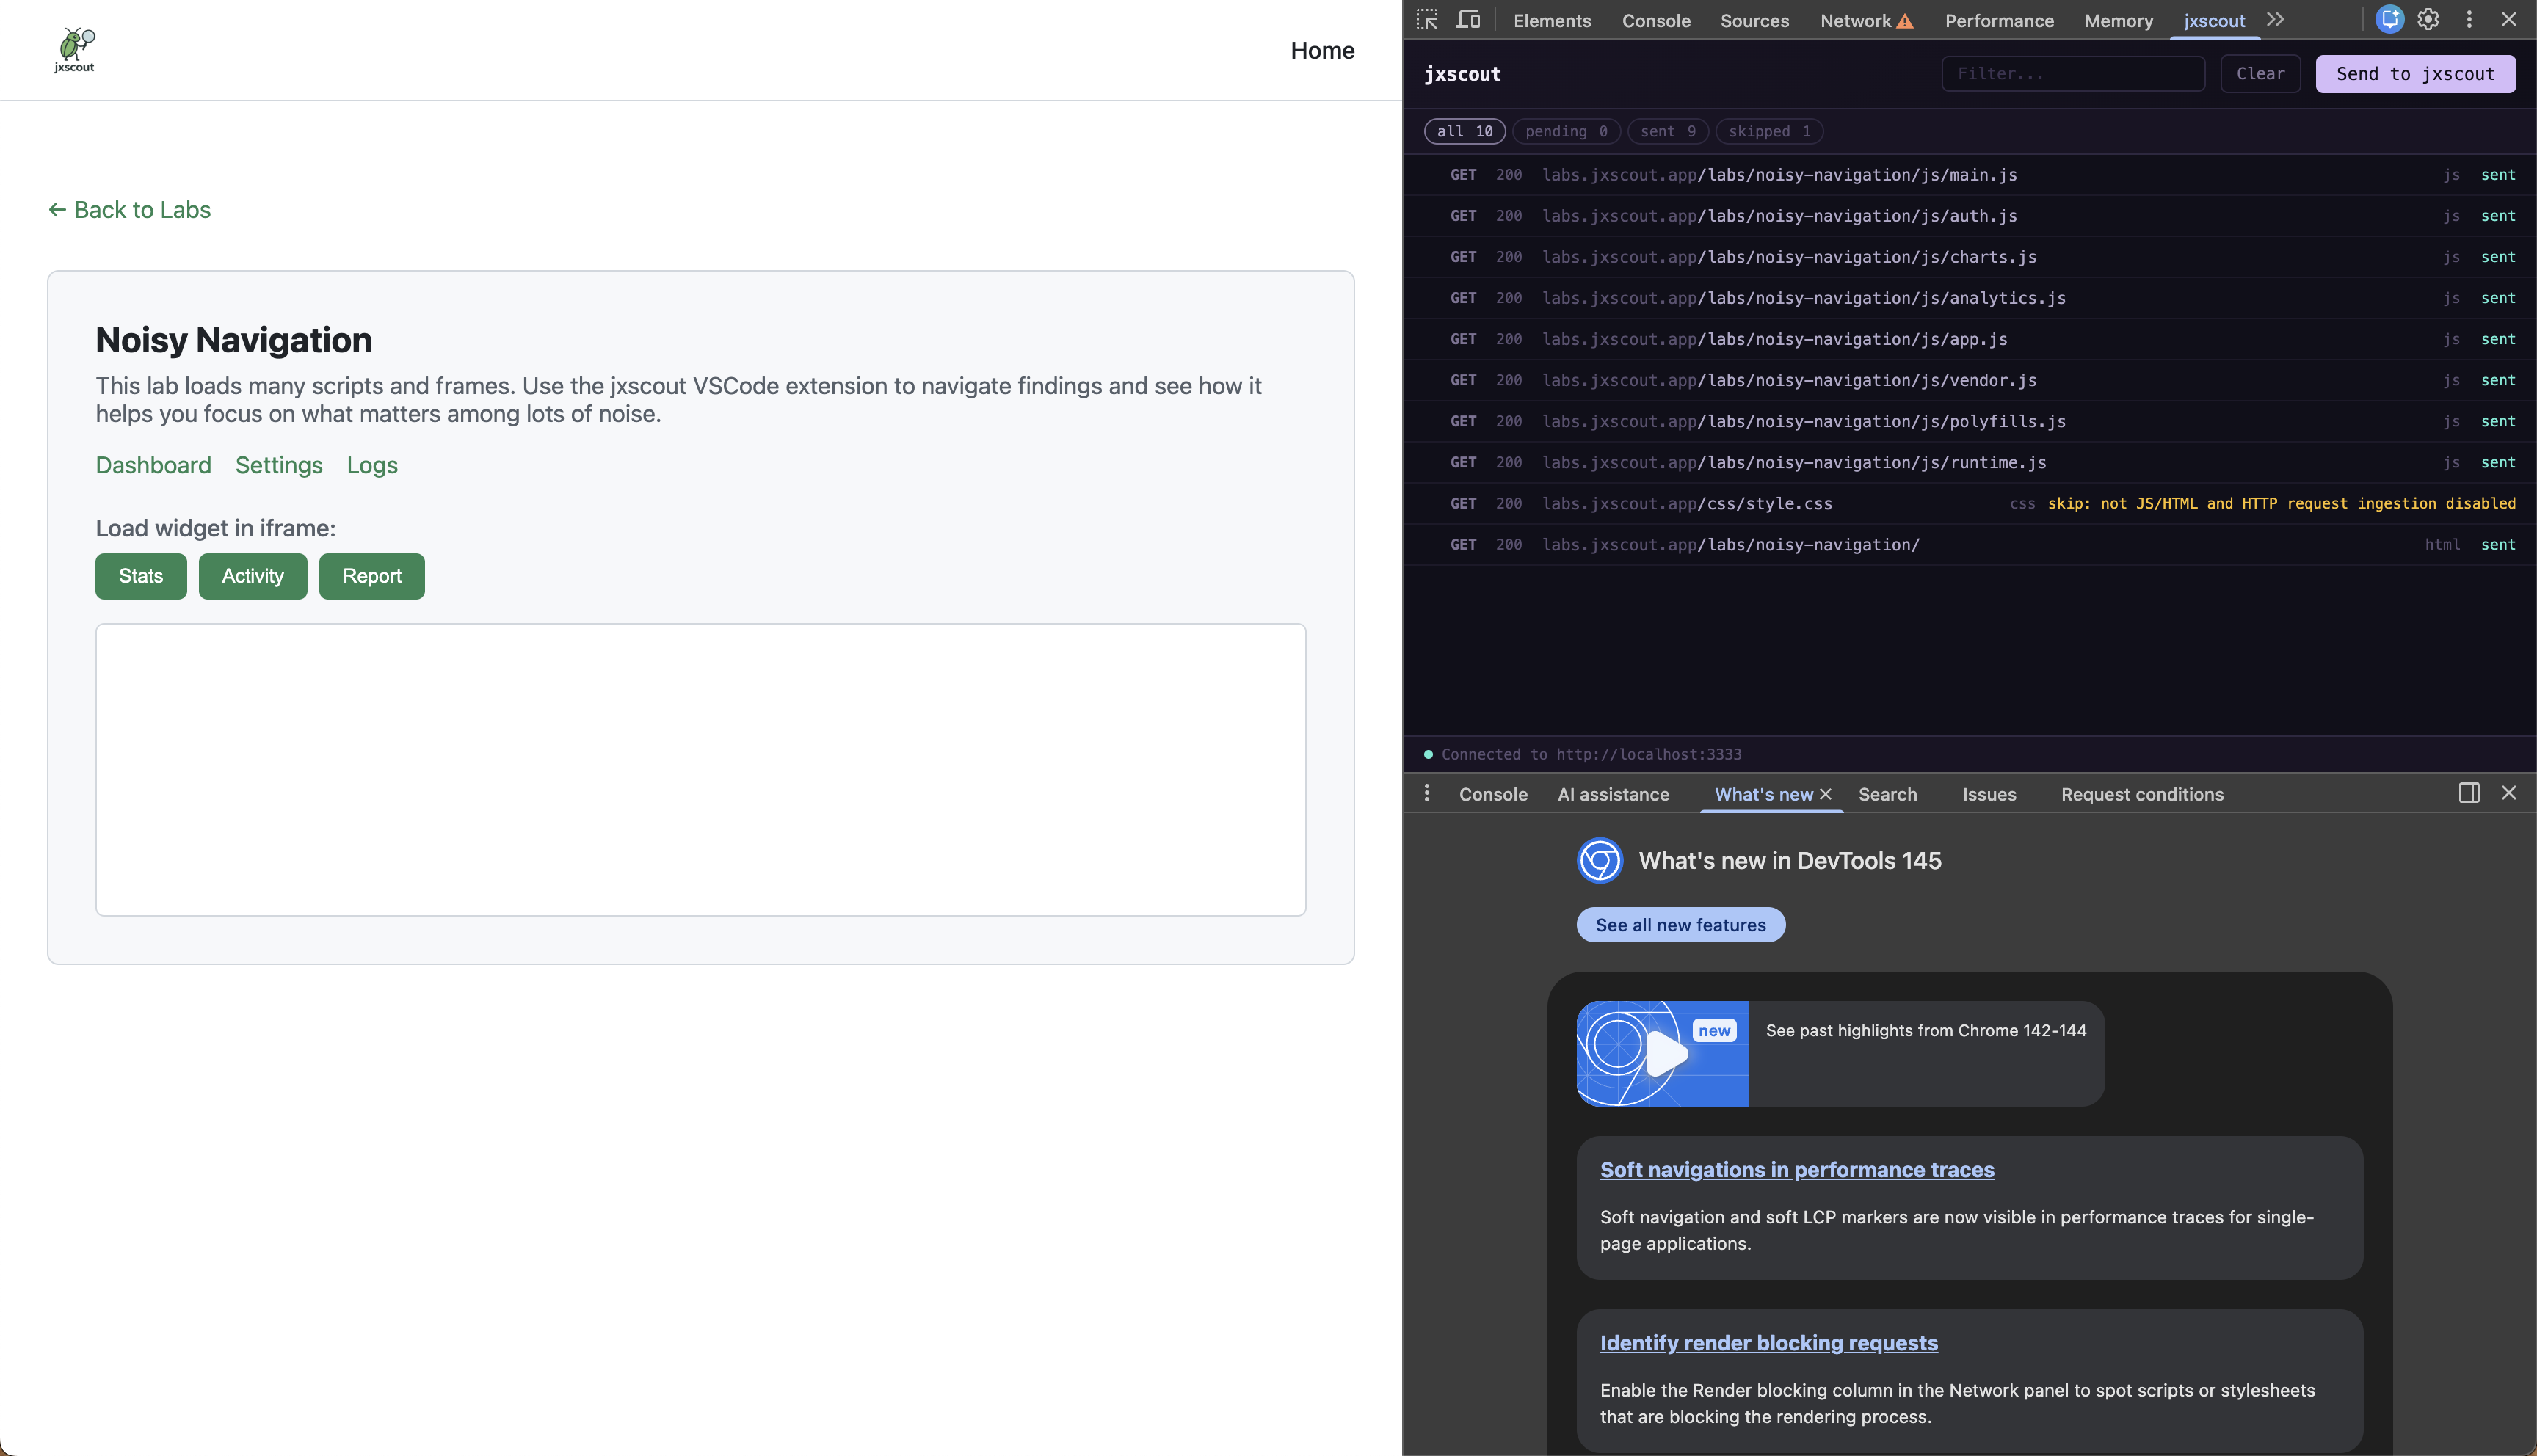
Go to your browser, make sure that it is pointing to your proxy (Burp or Caido) and load a random page. If everything is configured correctly, you should see some requests flowing through on the Overview page of the jxscout CLI.
Installing the VSCode Extension (recommended but optional)
After you complete the steps above, HTML and JS files should already be saved to your file system and ready for you to analyze.
However, most of the power that jxscout brings comes from the analysis results that are shown in the VSCode extension. So it's highly recommended to use the VSCode extension.
To install the VSCode extension, you can use the following command:
$ jxscout-pro-v2 -c install-vscode-extension
If you have cursor or code in your PATH, you can use those installation options; otherwise, you can use the Manual option and install the .vsix manually. You can refer to VSCode docs on how to do that.
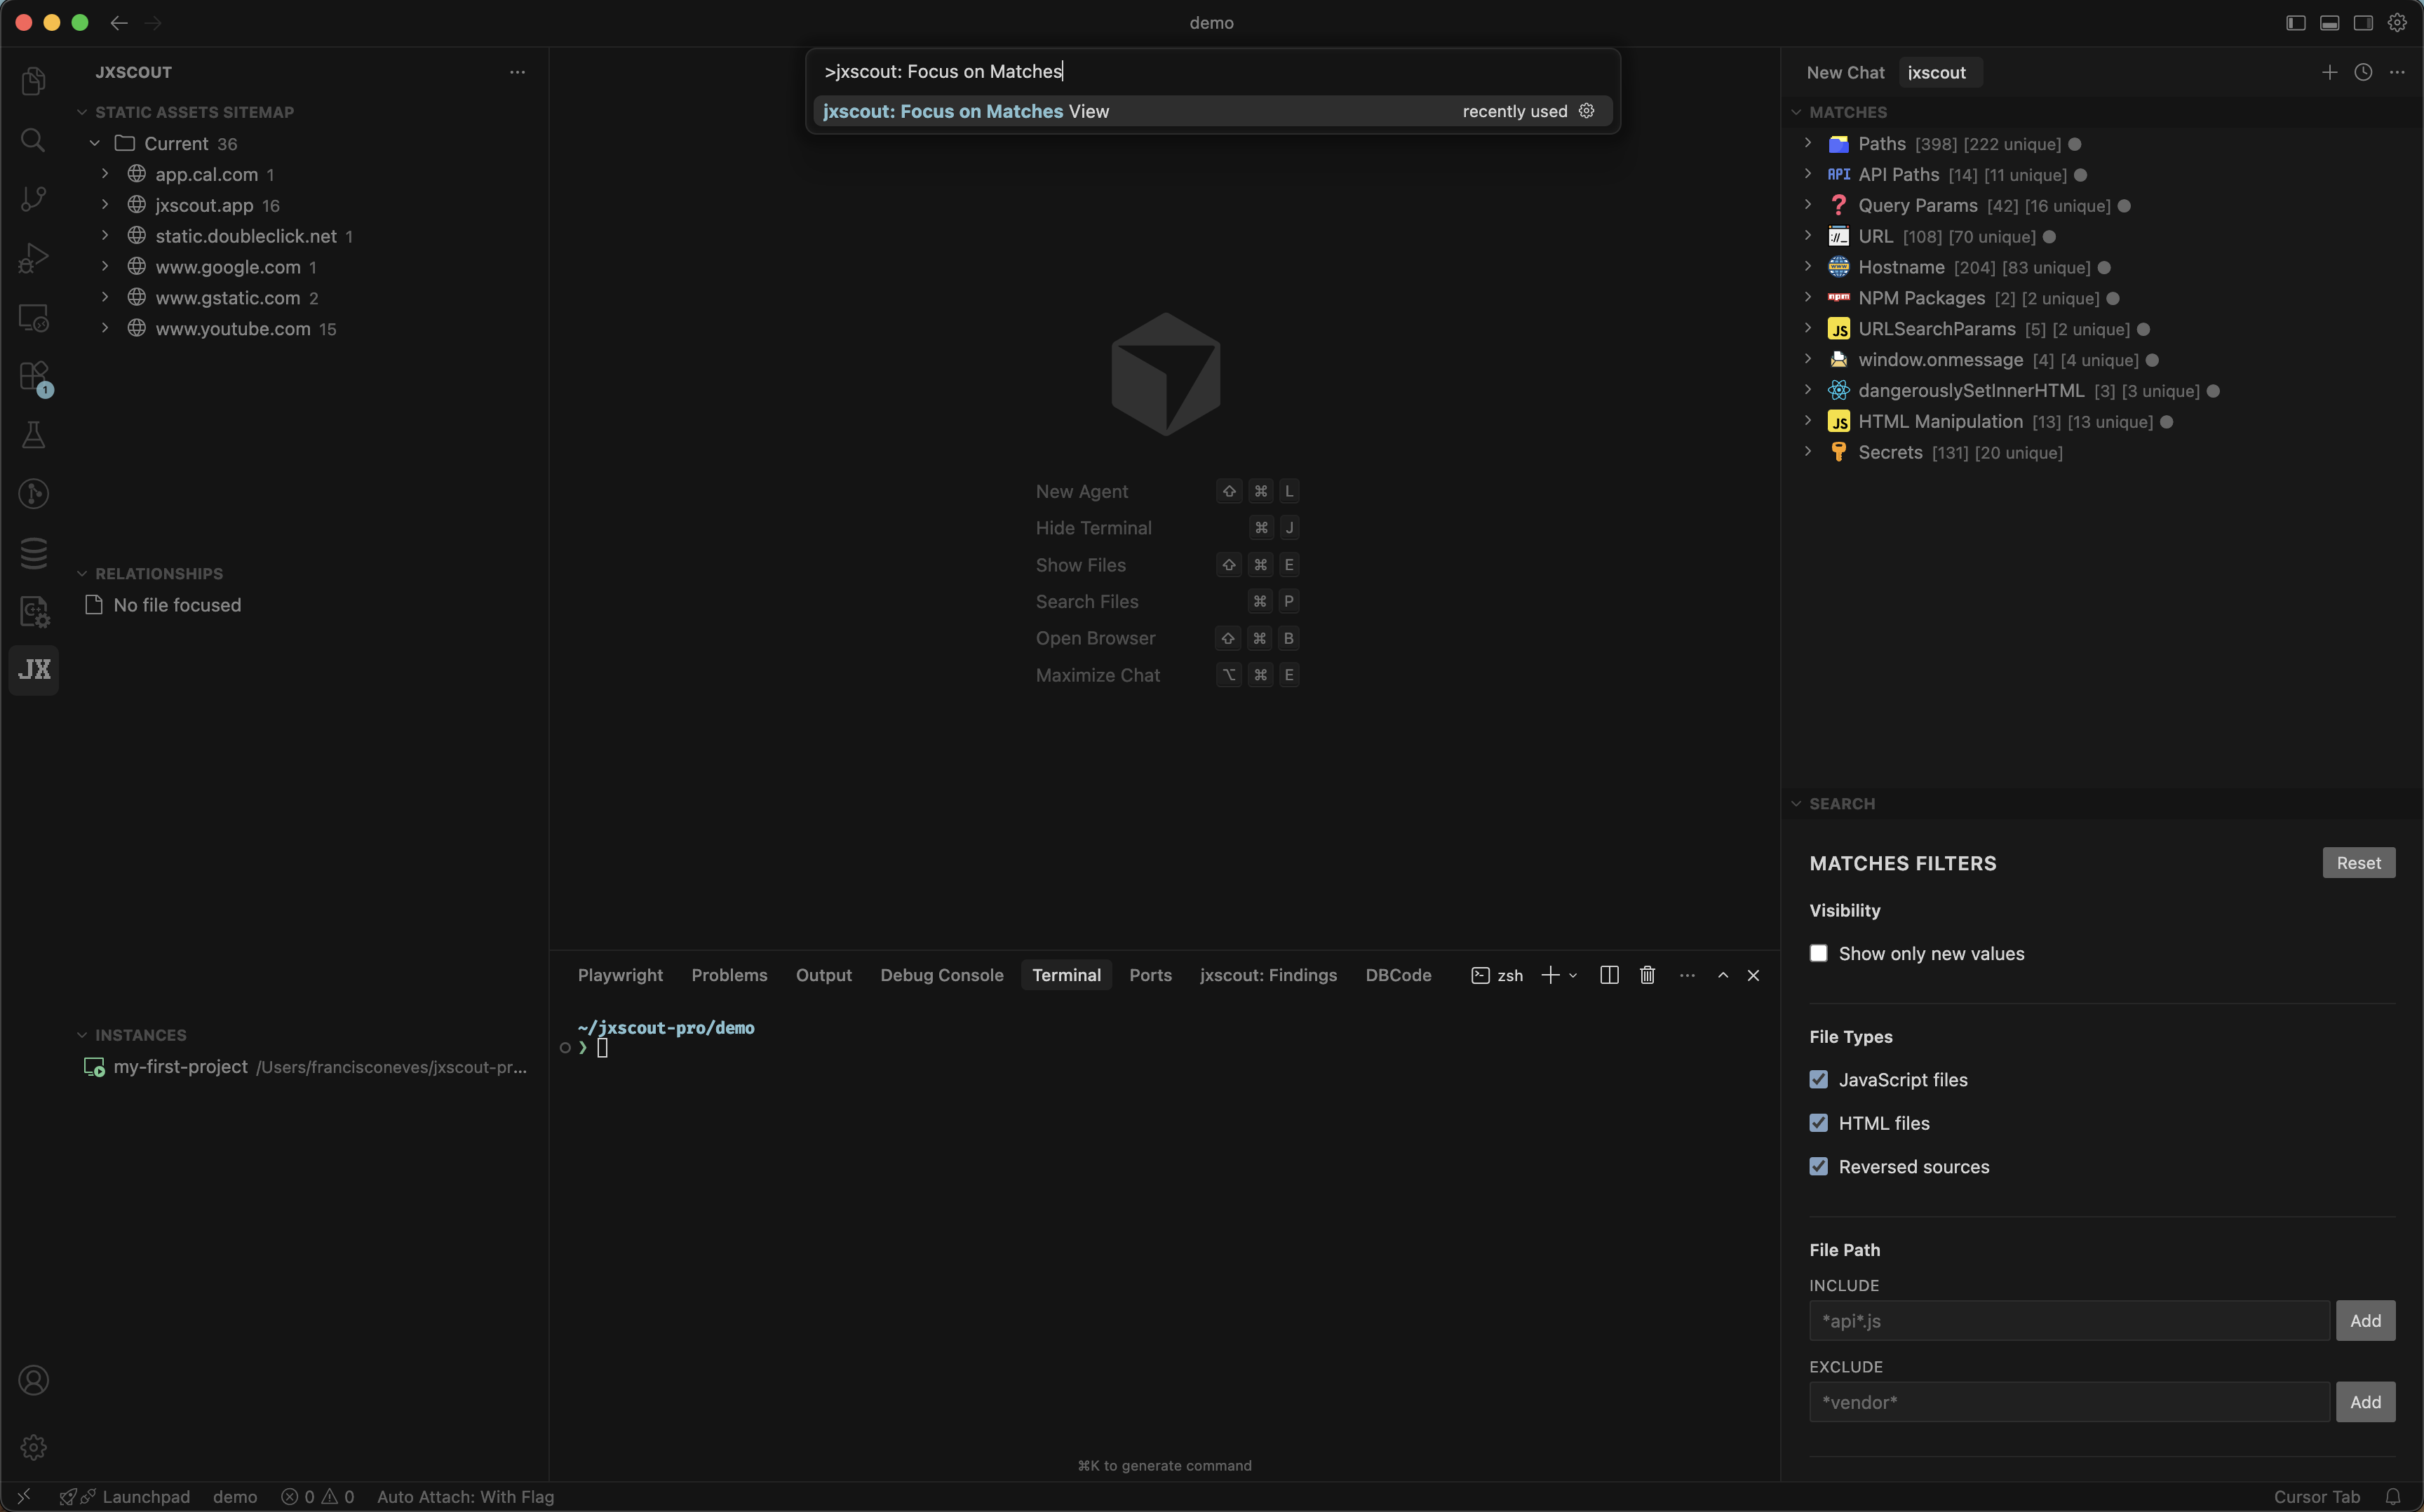
After installing, reload your editor and you should see a new icon on the sidebar for jxscout. If you can't find it, you can also use Ctrl+Shift+P and search for jxscout: Focus on Matches View; VSCode will open the jxscout extension.
If you are not running jxscout on the default port (3333), make sure that the VSCode extension is pointing to the right port. You can configure the port on the "Instances" view in the jxscout extension.
You can rearrange the jxscout views as you would like by dragging the views and placing them on the right/left/bottom bars of VSCode.
Installing the Chrome Extension (recommended but optional)
To get all the power from jxscout, it's recommended that you install the jxscout browser extension.
The extension informs jxscout how assets are related and allows jxscout to keep track of loader relations and iframe relationships, which can help with your testing. It also allows jxscout to keep an updated snapshot of which files a certain route loads, so jxscout can detect dangling JS files that are no longer referenced by any page.
To install the browser extension, run the following command to download it:
$ jxscout-pro-v2 -c download-browser-extension
After downloading, you should:
- Unzip the downloaded file
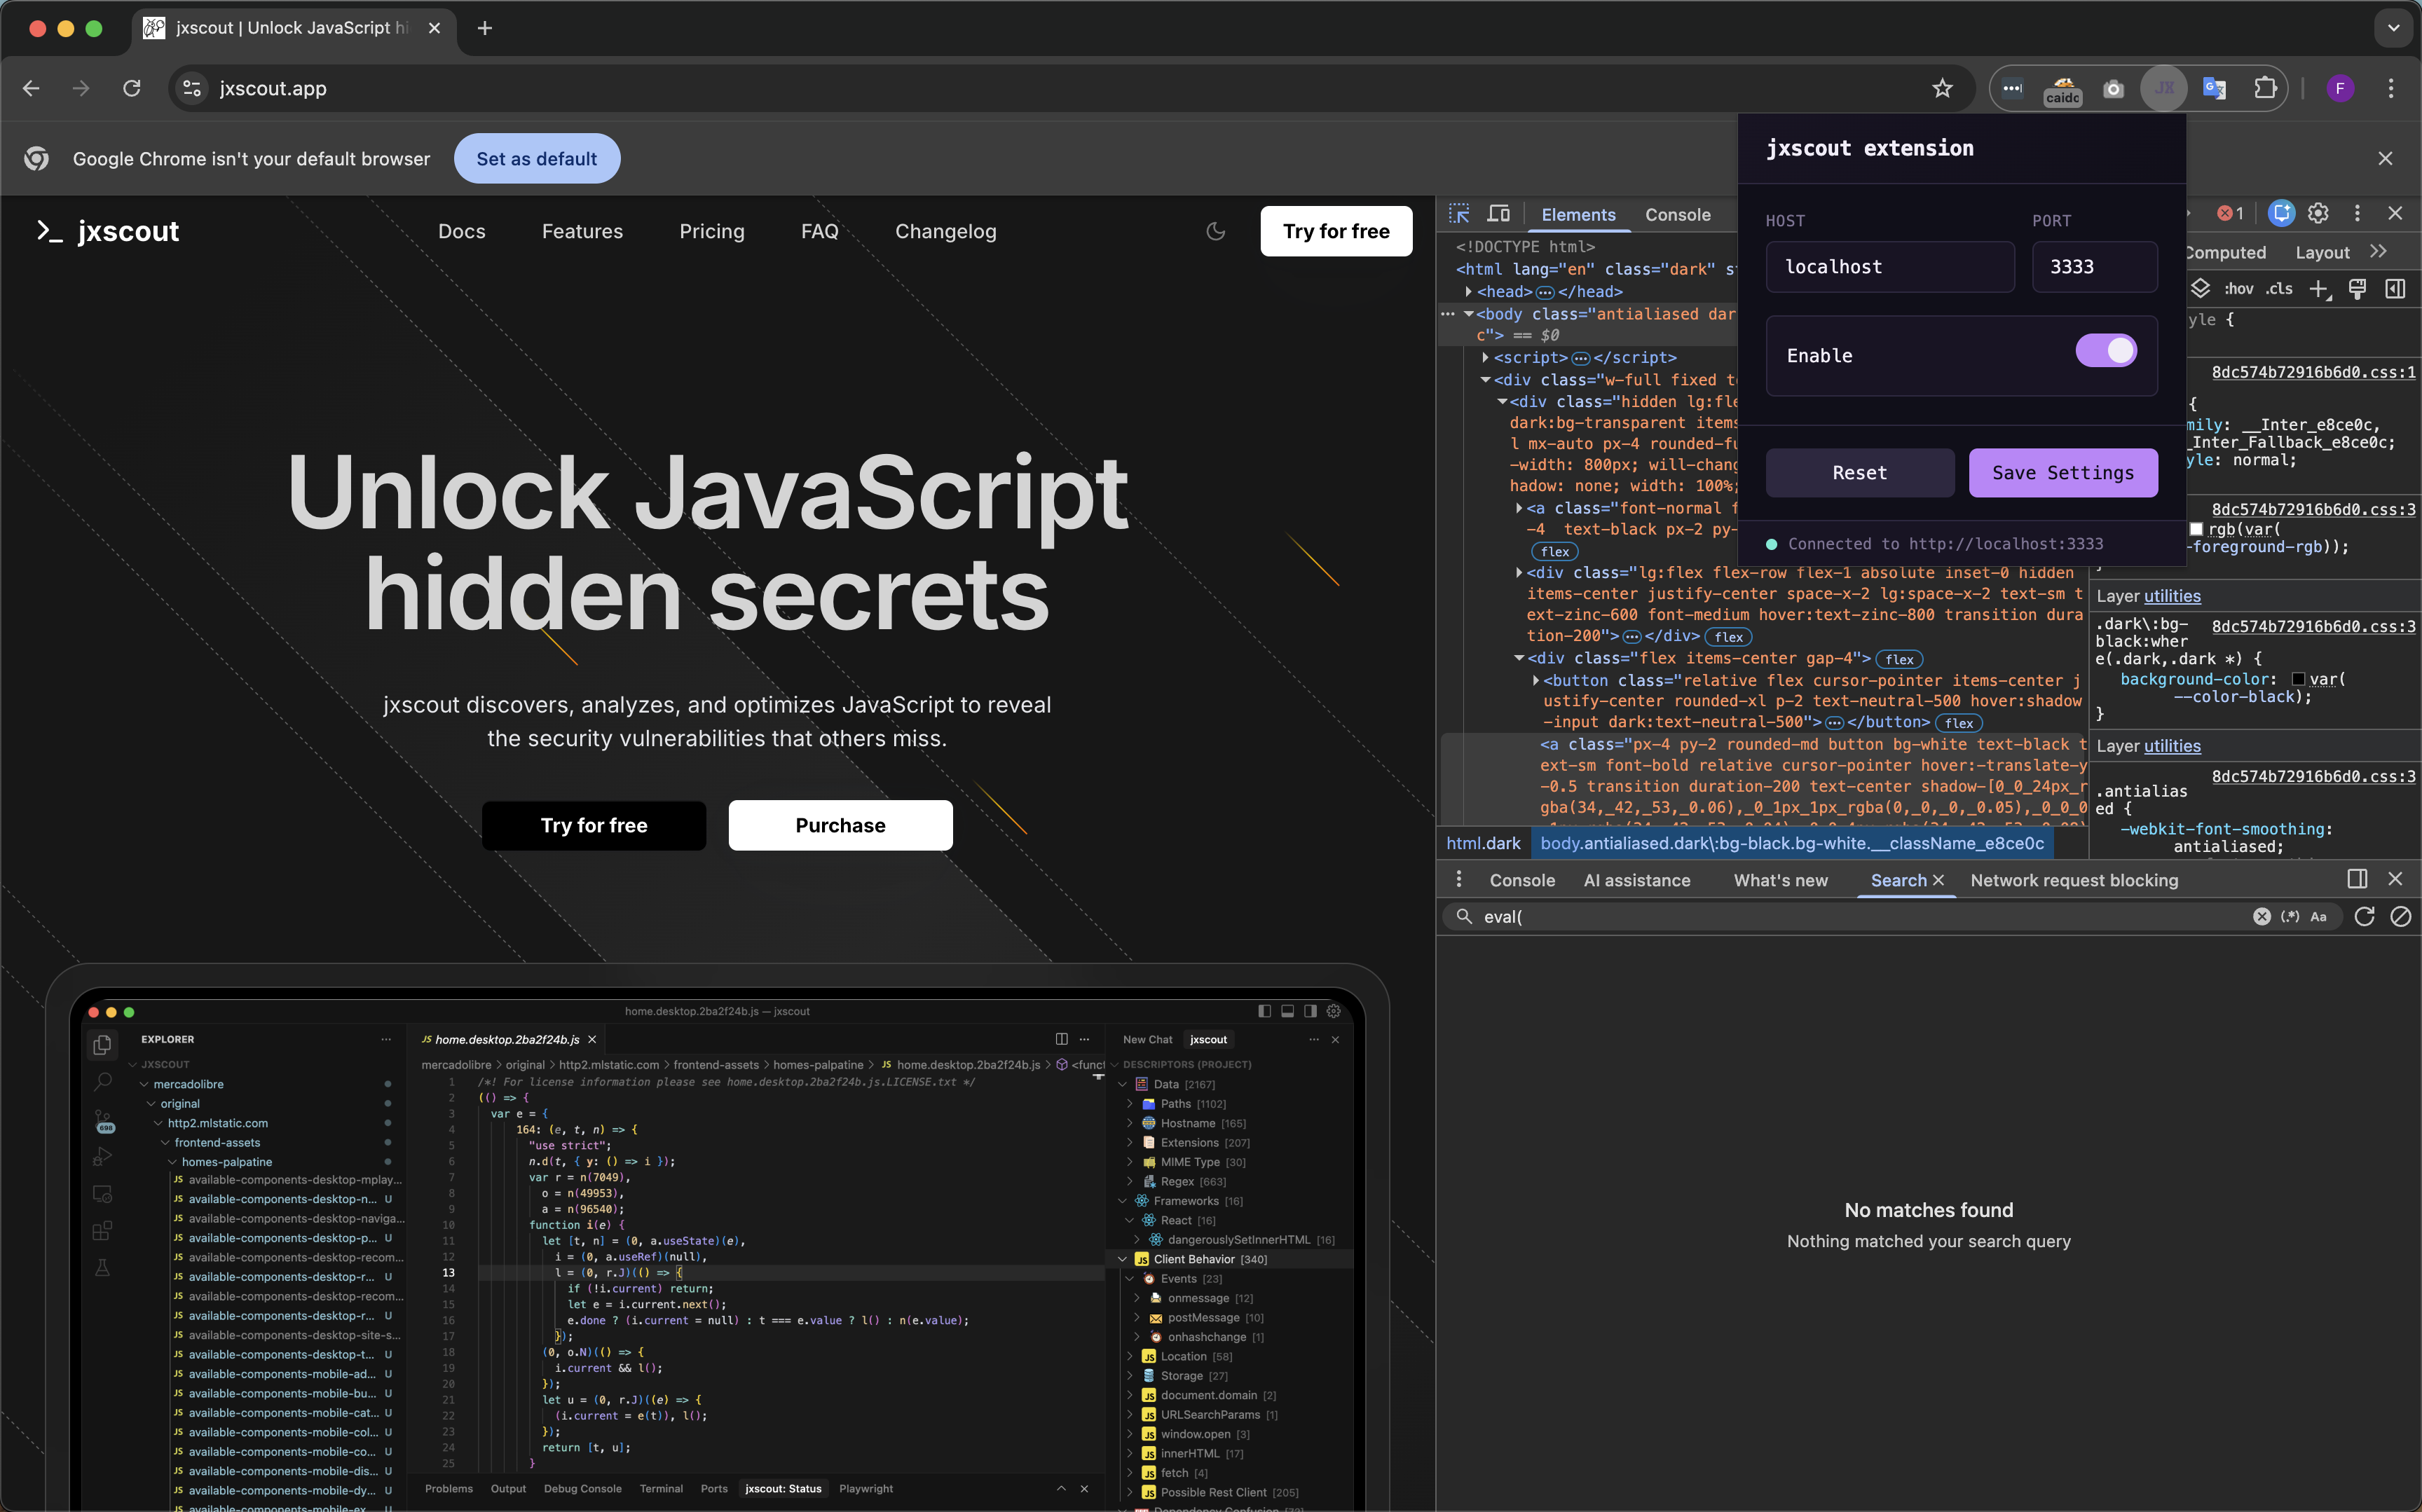
- Open Chrome and go to chrome://extensions
- Enable Developer mode (toggle in the top right)
- Click Load unpacked
- Select the unzipped extension folder
Make sure that the browser extension is pointing to the correct port where jxscout is running.
Alternative ingestion options
Using the Burp/Caido plugin is the recommended way to get requests into jxscout, but there are other ingestion methods available depending on your workflow.
Using jxscout as an upstream proxy
Instead of using the plugin, you can configure jxscout as an upstream proxy for Burp or Caido. This is useful for automation purposes, since you can proxy requests through jxscout directly from automated tools and scripts without needing to go through Burp or Caido. Keep in mind that when using the plugin approach, automated traffic like scans and fuzzing from Burp/Caido will also be sent to jxscout.
Burp upstream proxy configuration
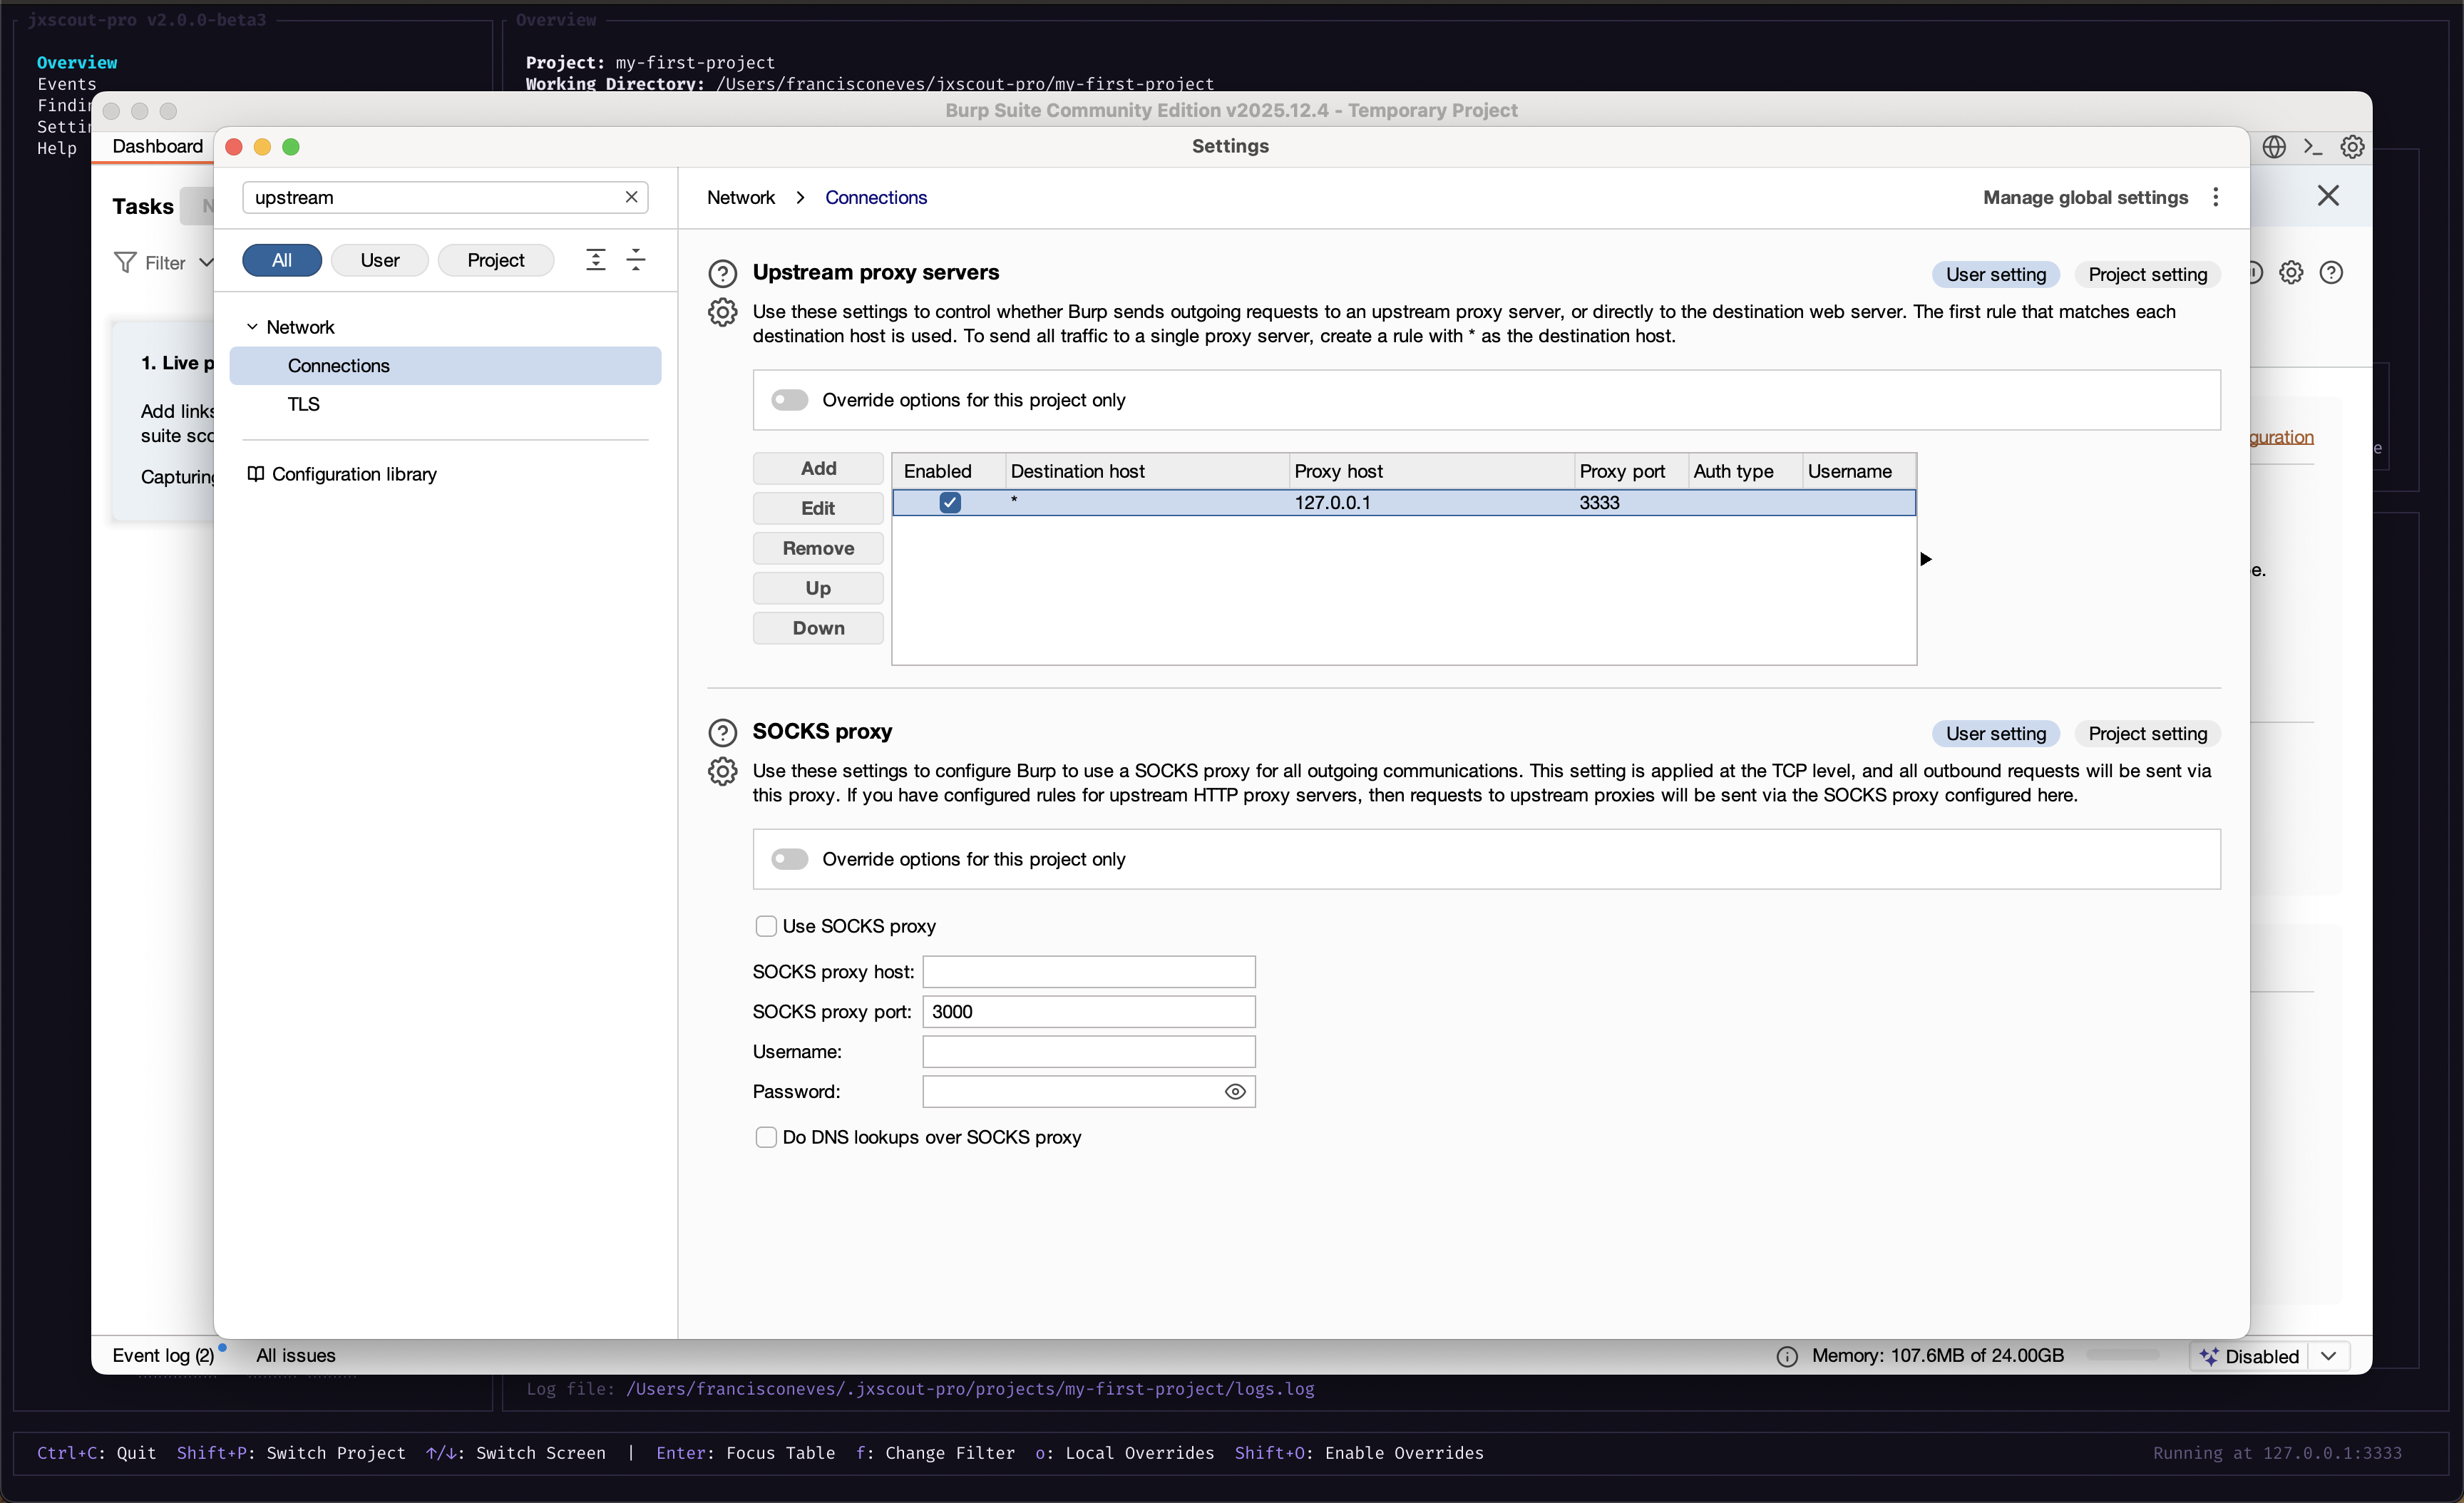
To configure jxscout as an upstream proxy to Burp:
- Go to Settings > Network > Connections > Upstream proxy servers
- Press Add
- Set Proxy host to
127.0.0.1and Proxy port to<jxscout port>(check the bottom right of the jxscout CLI for the port). - Make sure your browser is proxying requests through Burp.
- Save settings and reload a page in your browser.
Cert issues with out of scope setting
If you are using the out of scope setting on Burp, you might notice that some pages on your browser don't load because requests get immediately proxied to jxscout without having Burp terminating the SSL connection.
As a workaround to this problem, you can trust jxscout own certificate by adding the cert on ~/.jxscout-pro/ca.cer to your system trust root. The steps to do this are the same as the ones for trusting the certificate for Burp or Caido.
Caido upstream proxy configuration
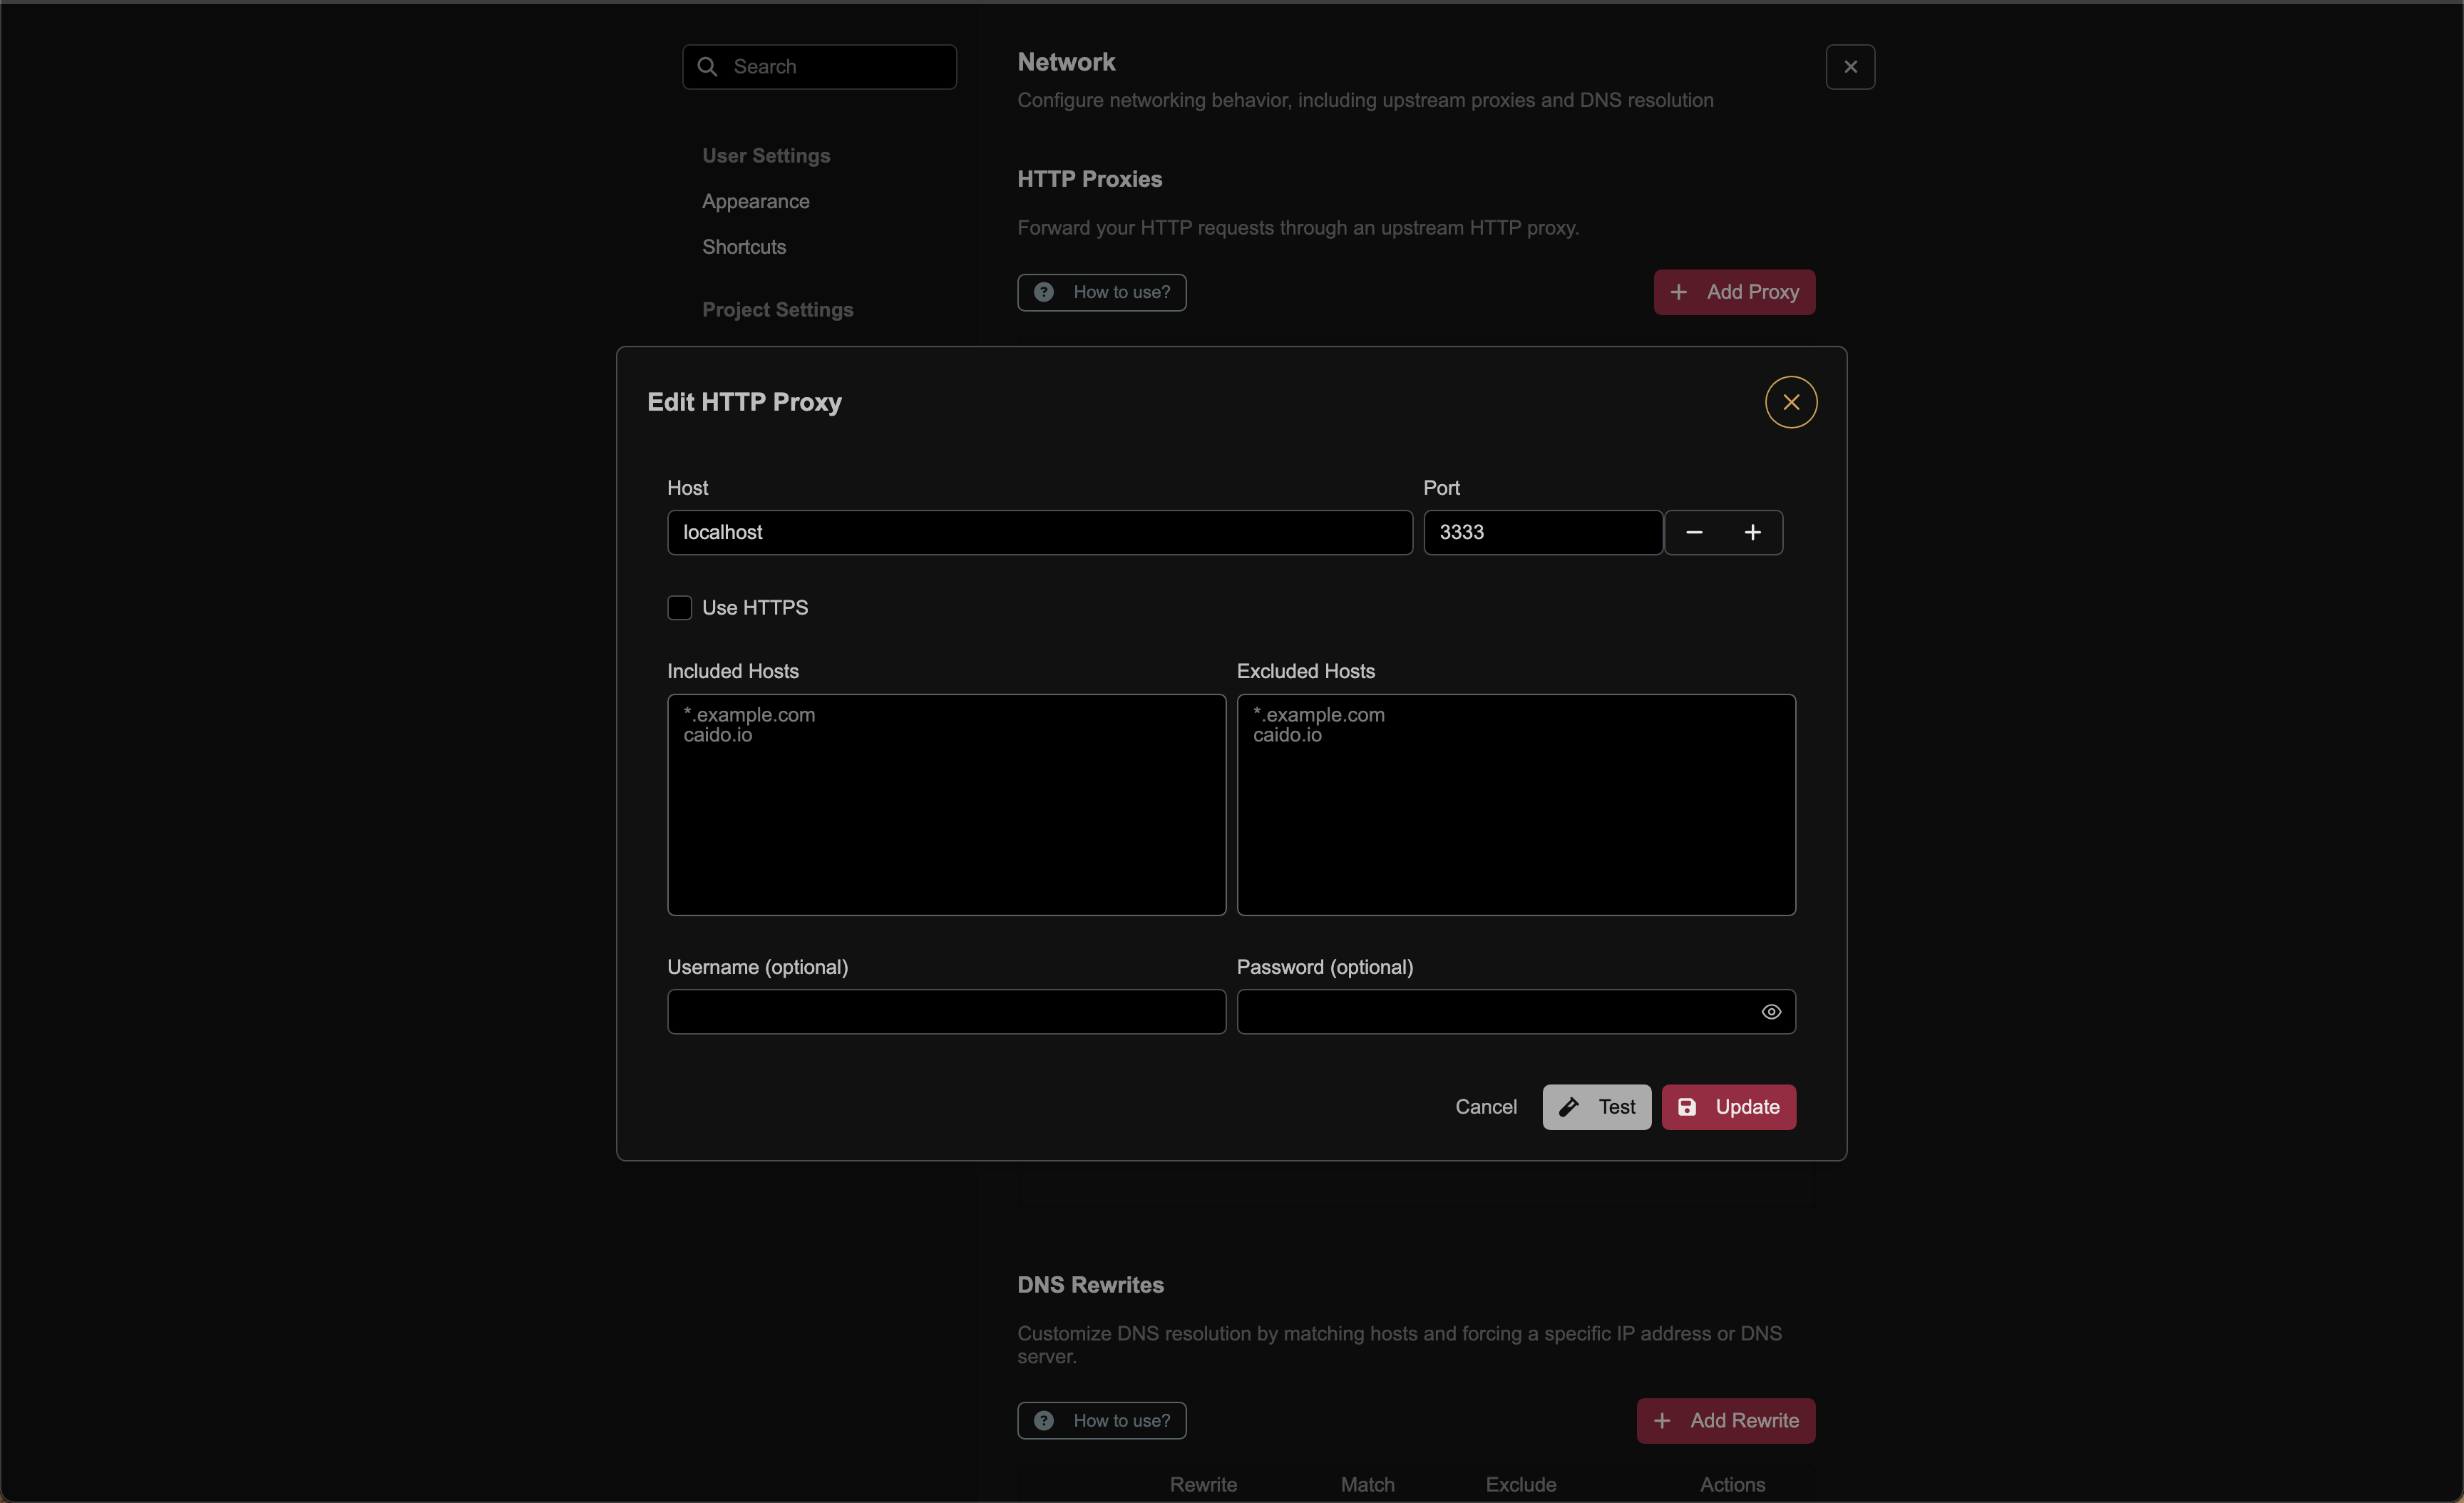
To configure jxscout as an upstream proxy to Caido:
- Go to Settings > Instance Settings > Network > HTTP Proxies
- Press Add Proxy
- Set Host to
127.0.0.1and Port to<jxscout port>(check the bottom right of the jxscout CLI for the port). Don't select "Use HTTPS". - Make sure your browser is proxying requests through Caido.
- Save settings and reload a page in your browser.
Using the browser extension
The browser extension allows you to manually send requests to jxscout from your browser. This is useful if you want a more ad hoc workflow, where you selectively ingest only files from the specific pages of your choice.
Setup complete
Congratulations! 🎉
After these steps, jxscout should be ready for you to start using it! You can now explore the tool on your own, but I recommend going through the tutorials to learn about the different features and capabilities of jxscout.
Thanks for using jxscout!